- Home >
- Stock Photos >
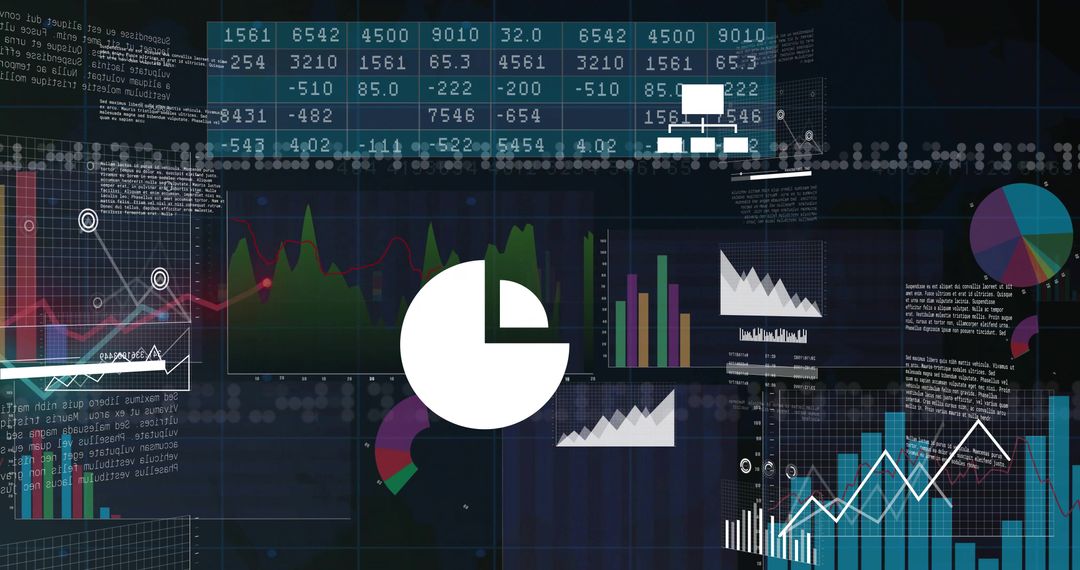
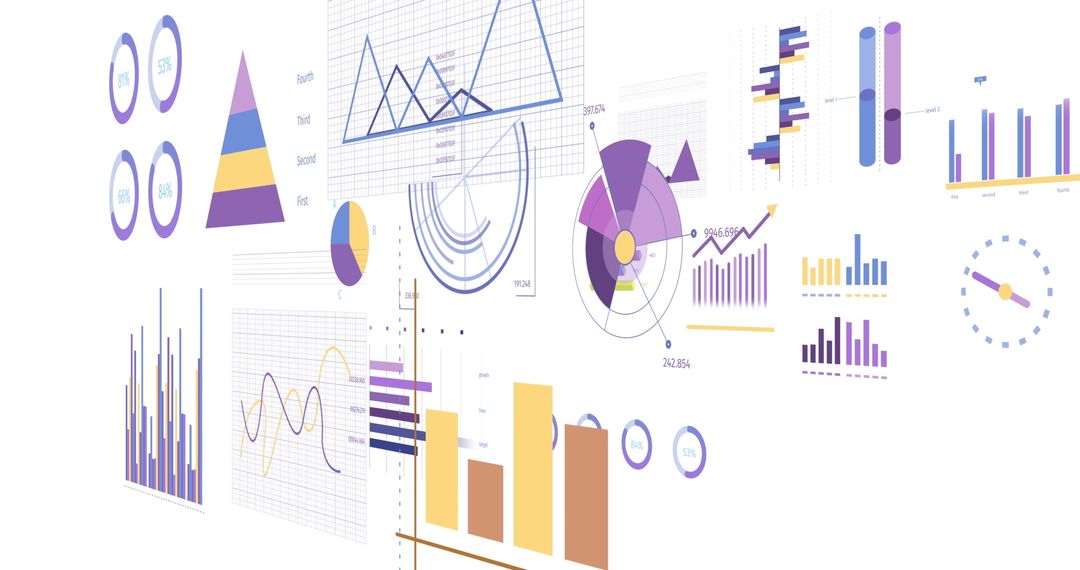
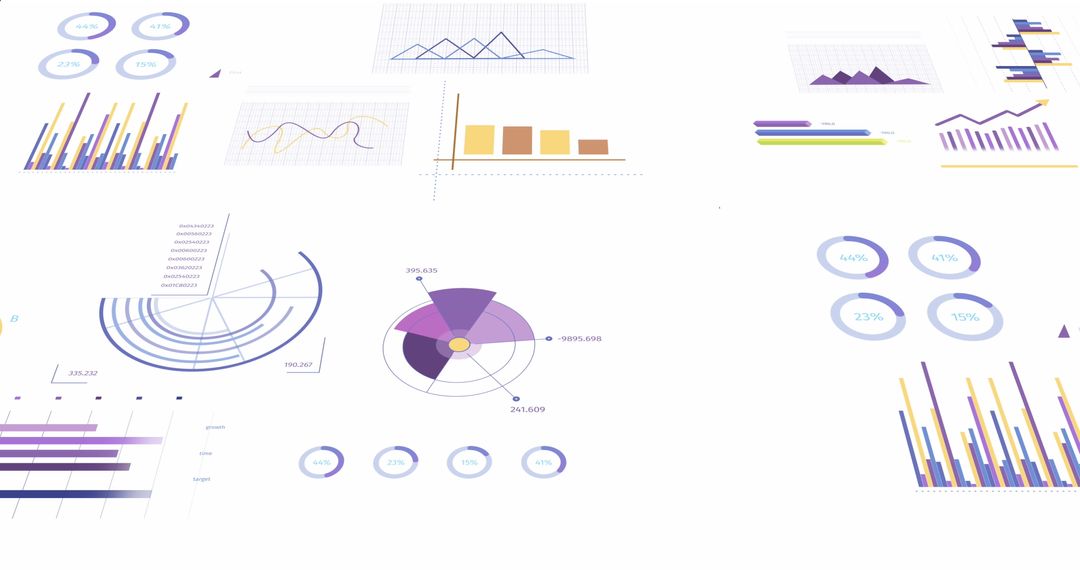
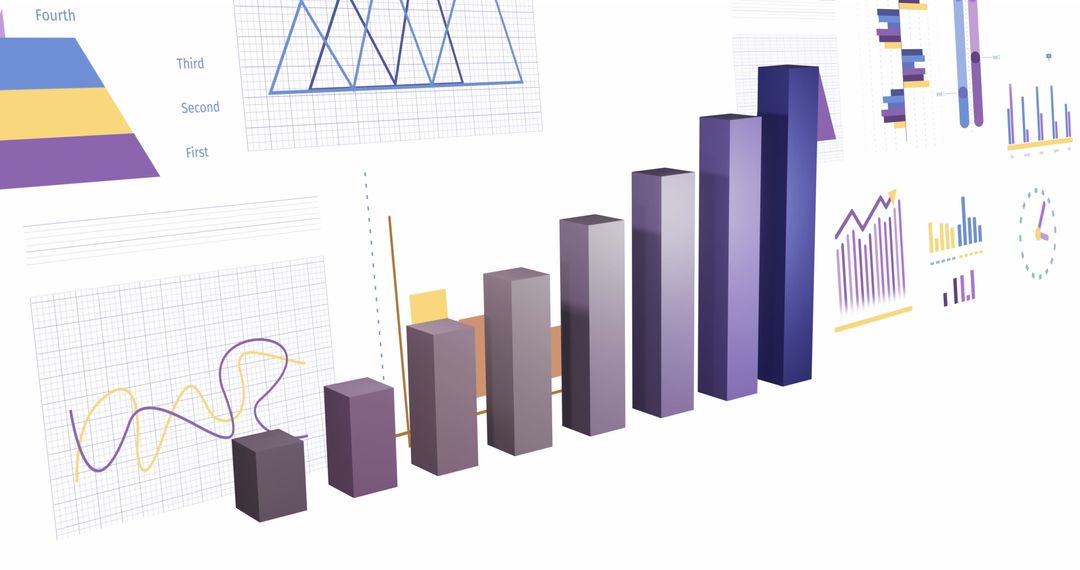
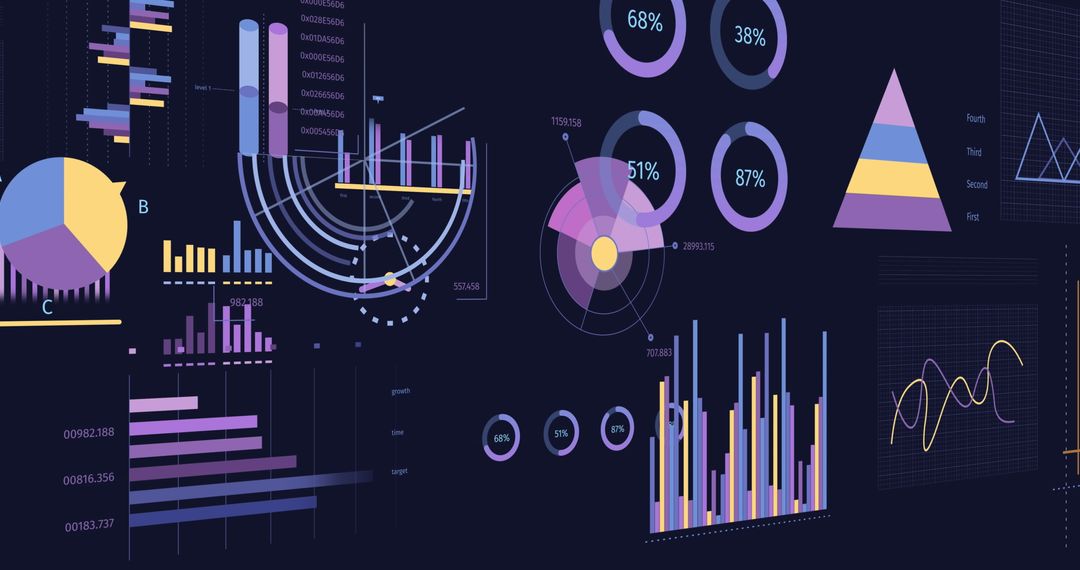
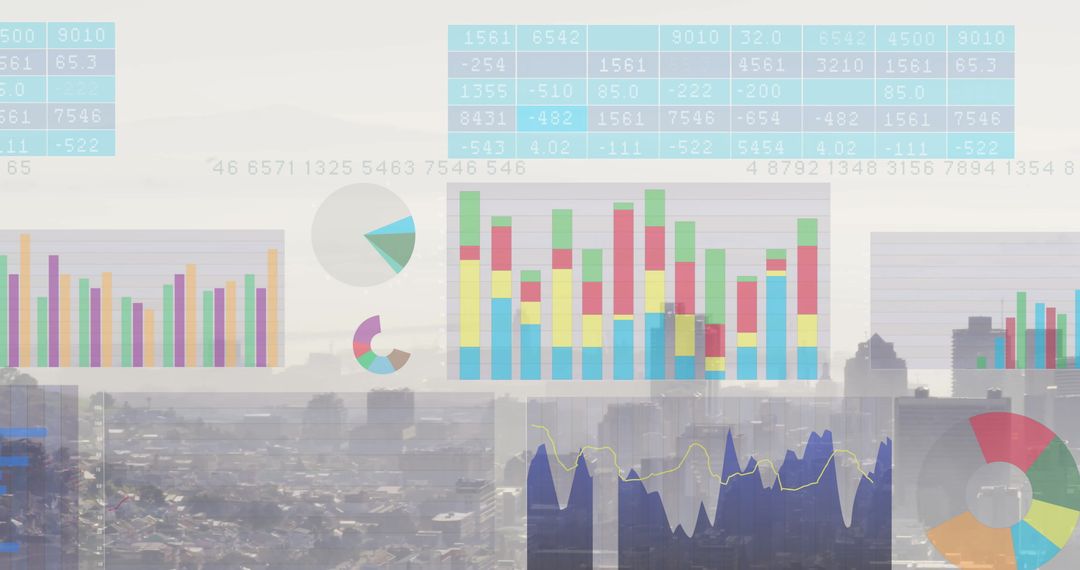
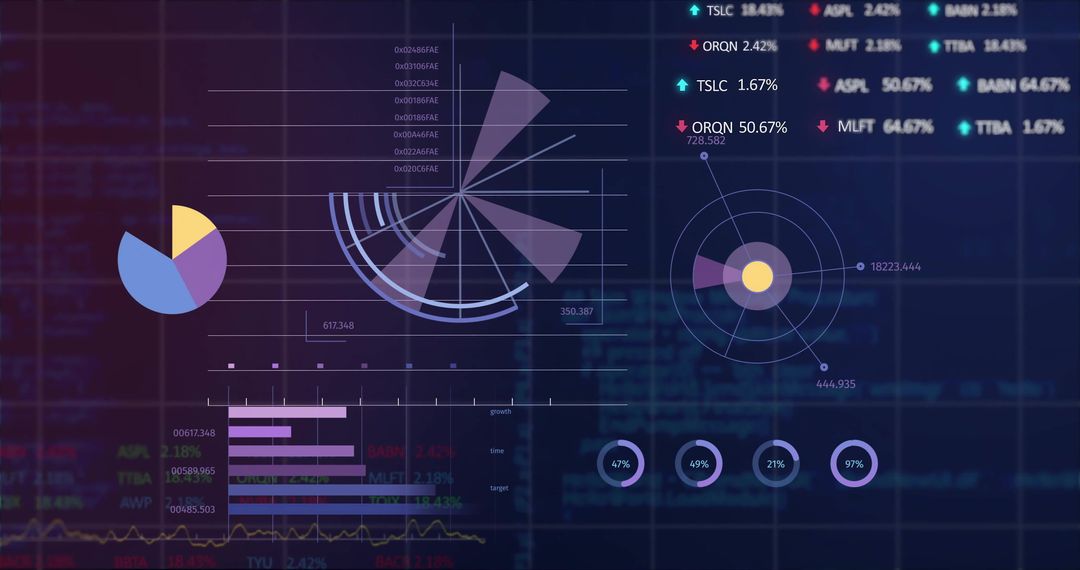
- Colorful Infographic Elements for Business and Data Analysis
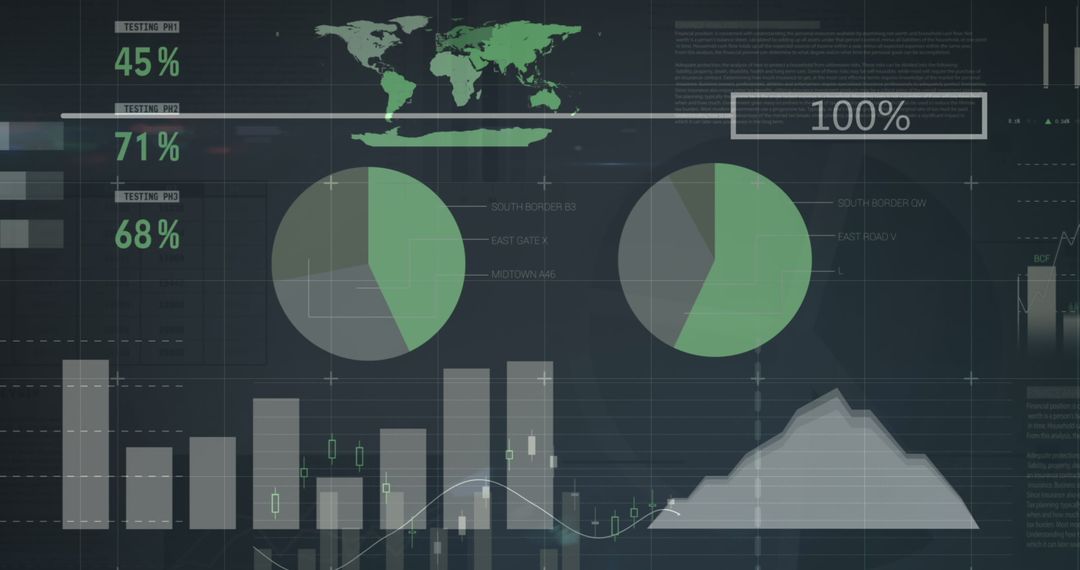
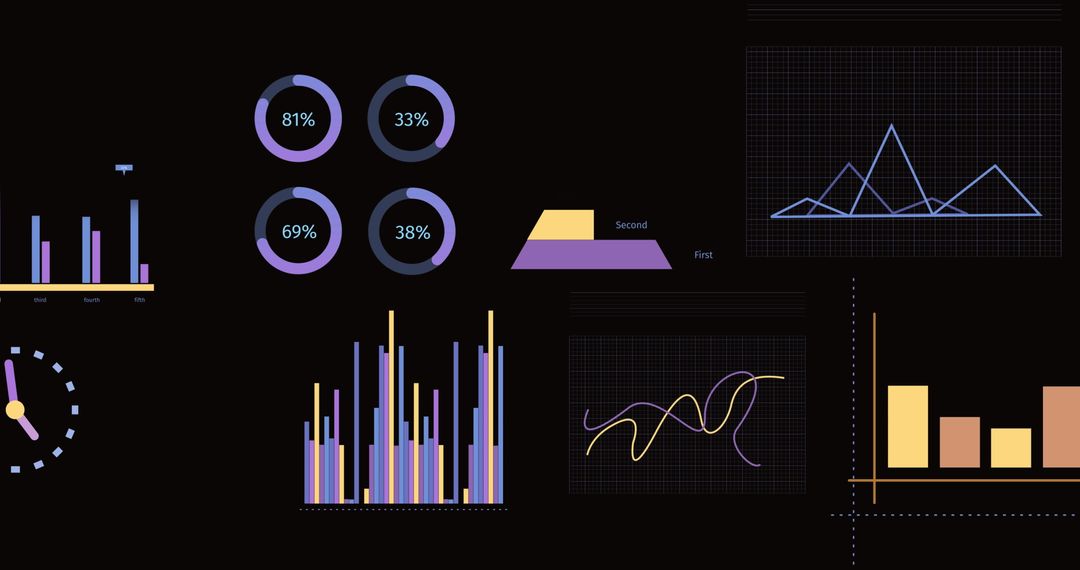
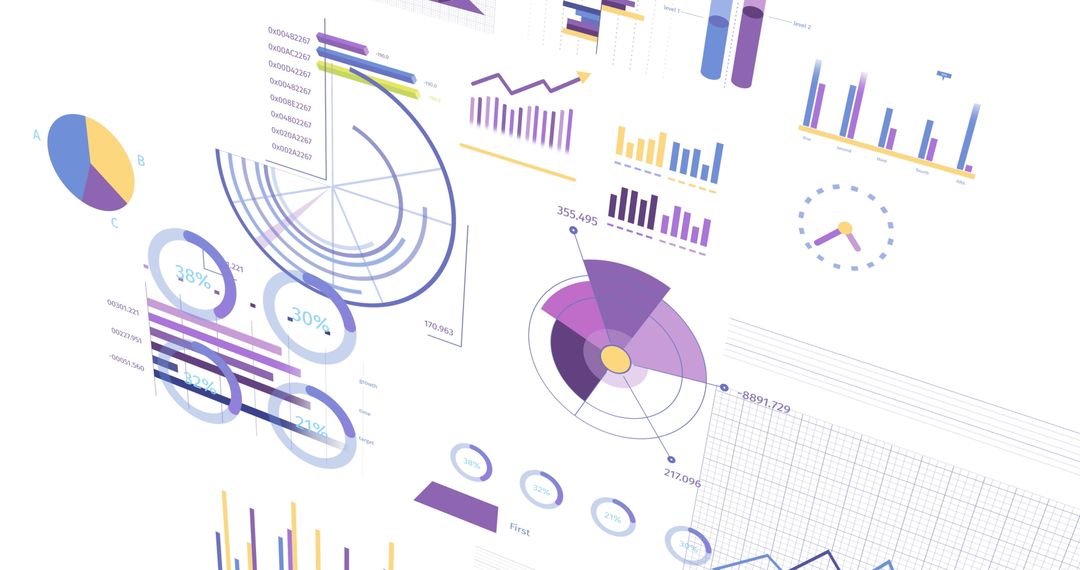
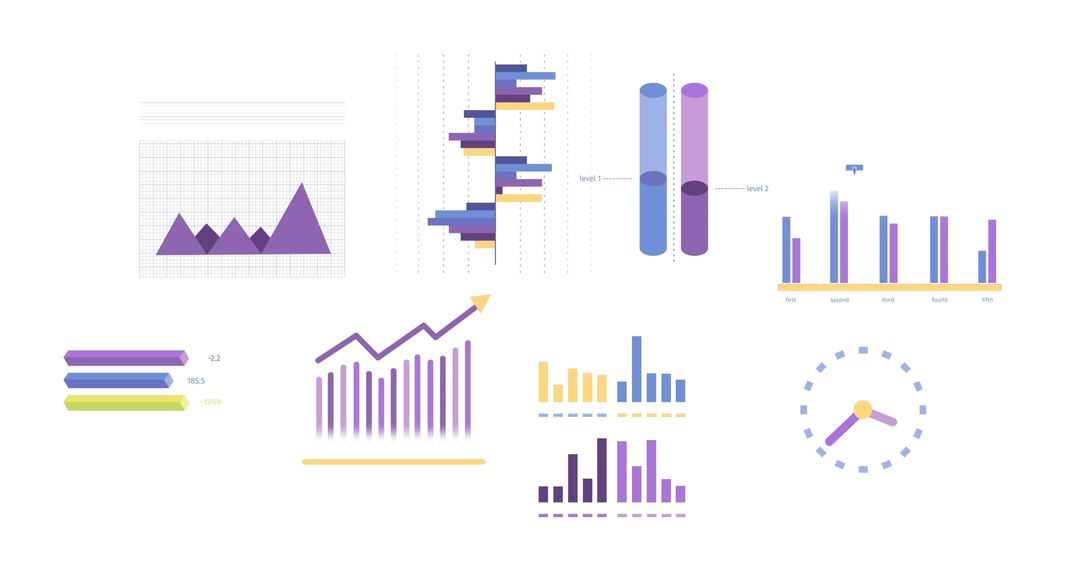
Colorful Infographic Elements for Business and Data Analysis Image

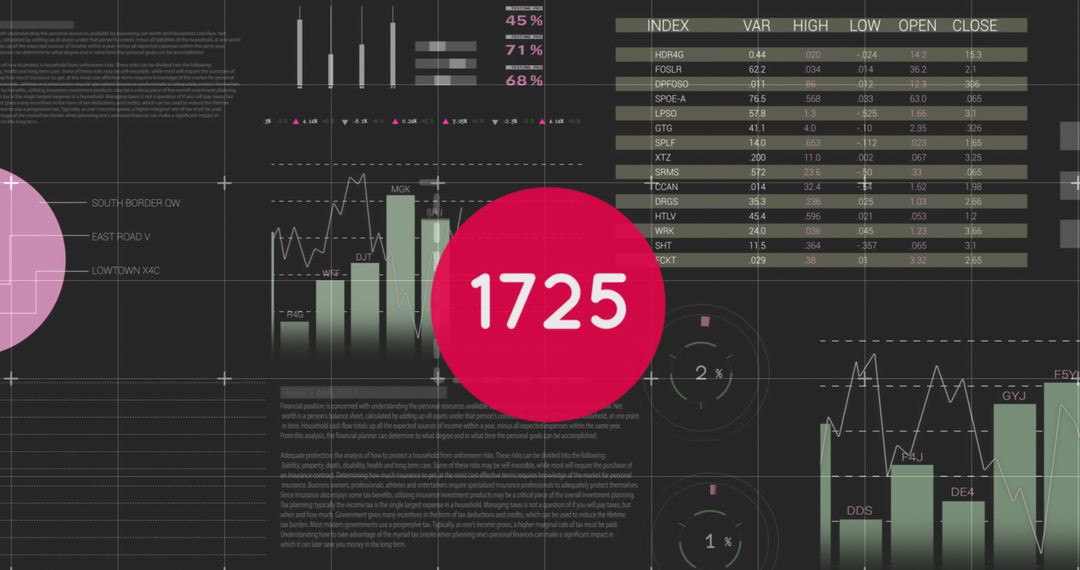
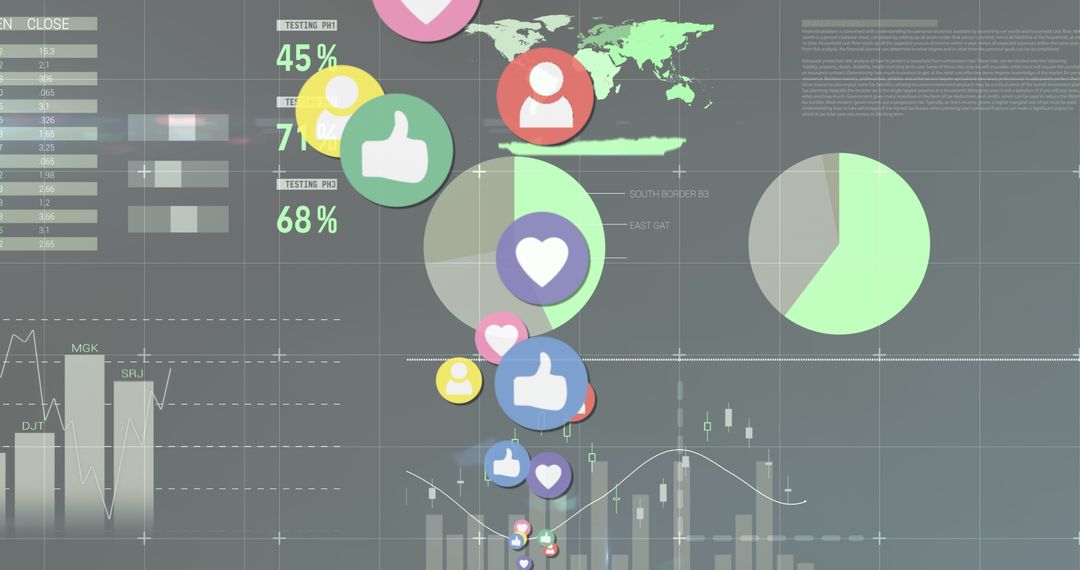
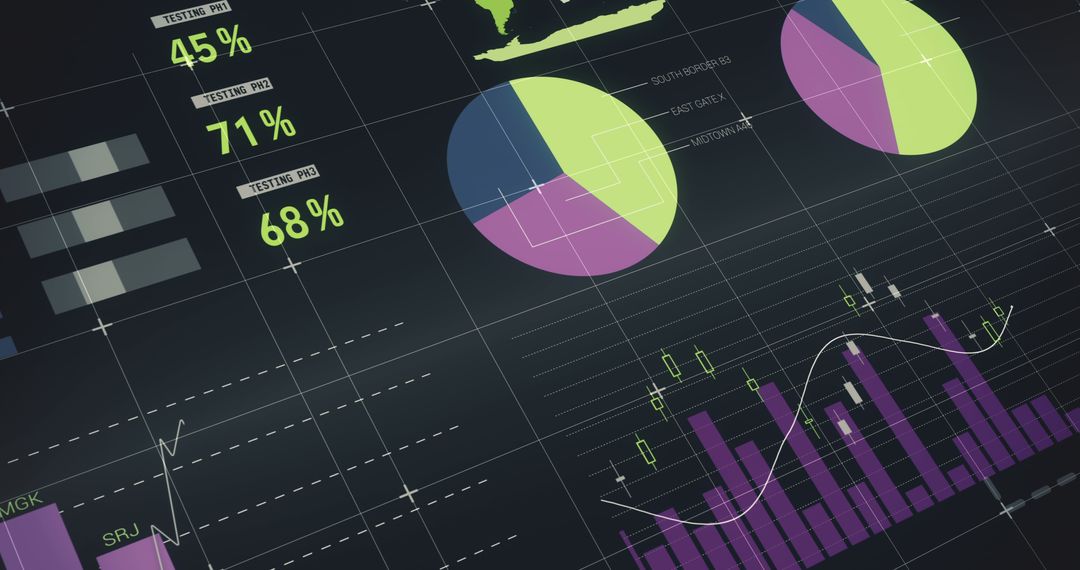
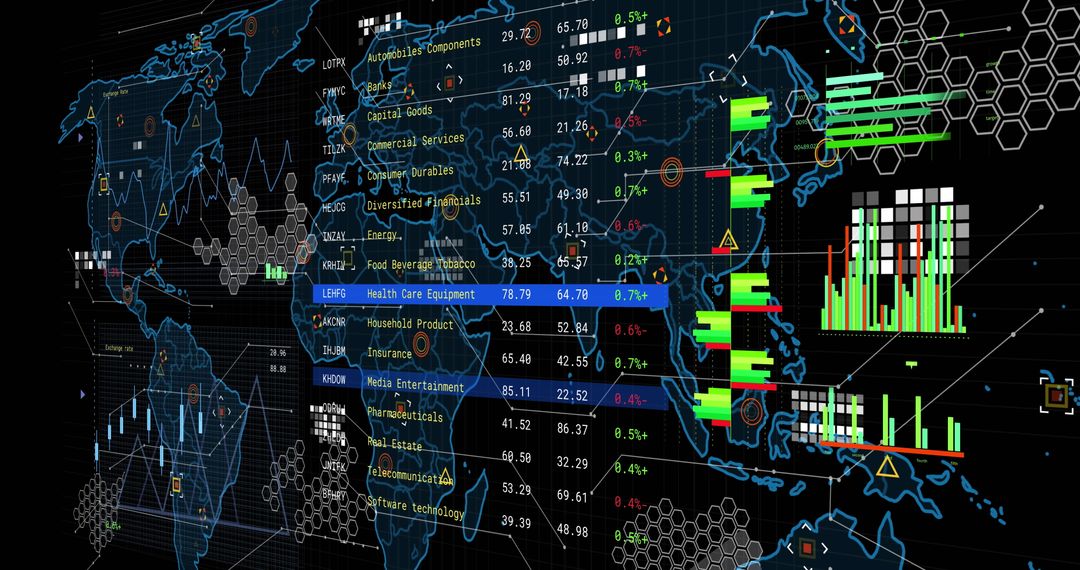
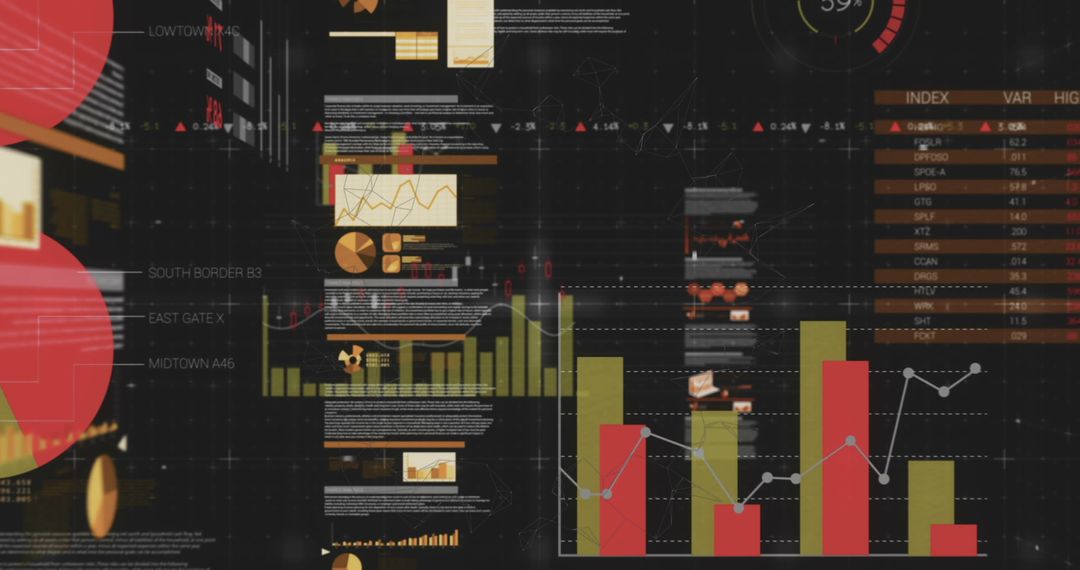
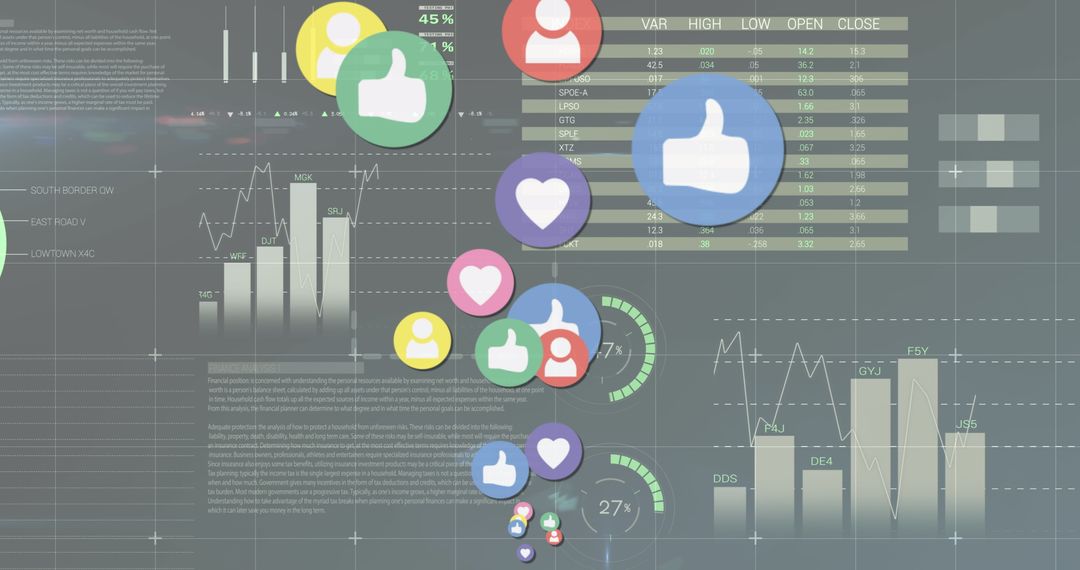
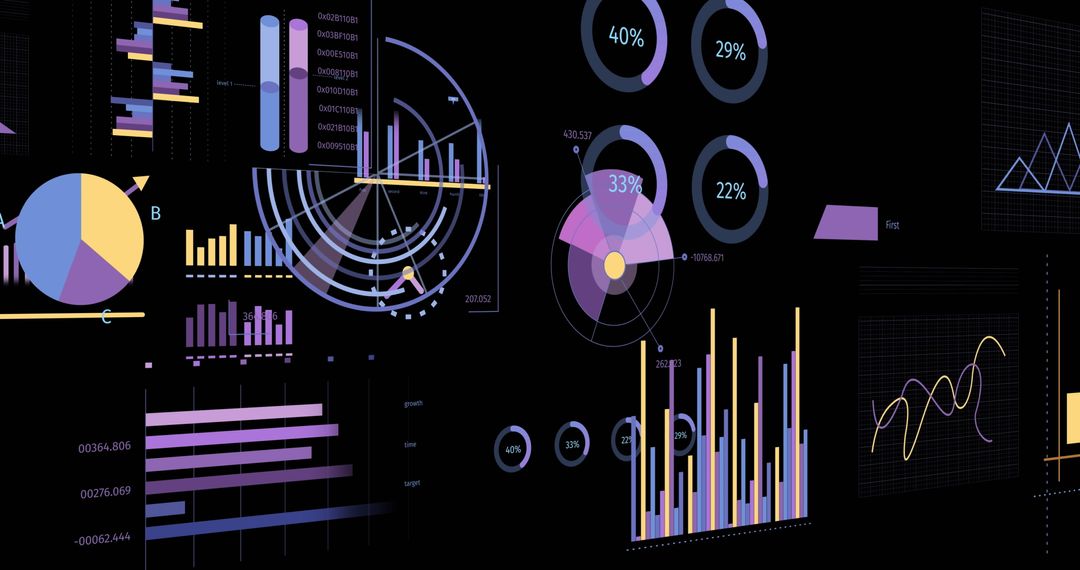
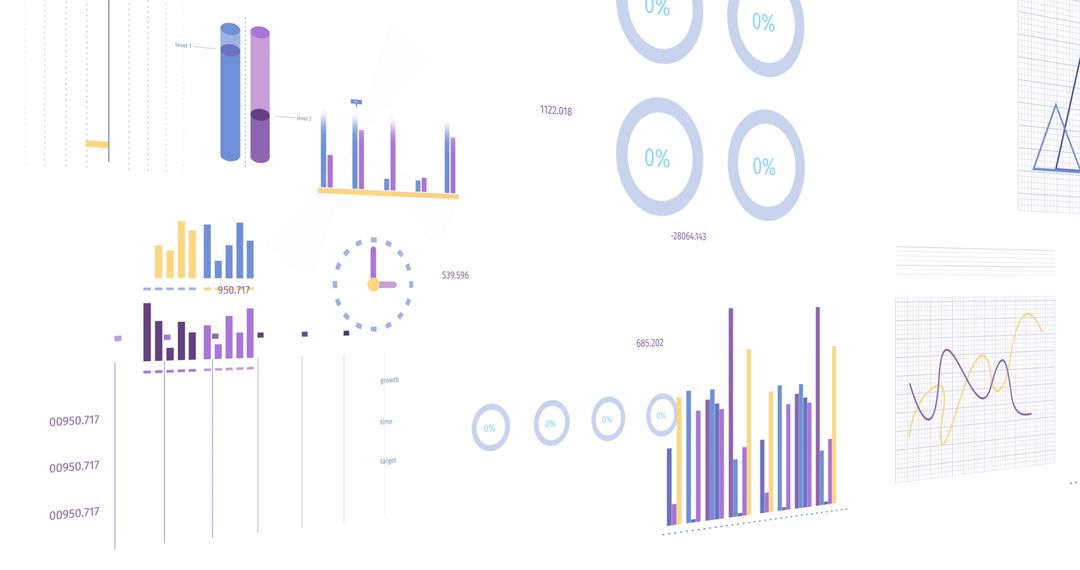
Vibrant and intricate infographic elements depict business and statistical data analysis. Effective for presentations, reporting, marketing materials, or educational content showcasing data analytics. Visual tools enhance understanding of complex information through clear visuals like charts and graphs.
Powered by  - Get 15% off with code: PIKWIZARD15


2
downloads
downloads
Tags:
More
Credit Photo
If you would like to credit the Photo, here are some ways you can do so
Text Link
photo Link
<span class="text-link">
<span>
<a target="_blank" href=https://pikwizard.com/photo/colorful-infographic-elements-for-business-and-data-analysis/cd0eeb77e7c64a0bd3a7f12b80a535db/>PikWizard</a>
</span>
</span>
<span class="image-link">
<span
style="margin: 0 0 20px 0; display: inline-block; vertical-align: middle; width: 100%;"
>
<a
target="_blank"
href="https://pikwizard.com/photo/colorful-infographic-elements-for-business-and-data-analysis/cd0eeb77e7c64a0bd3a7f12b80a535db/"
style="text-decoration: none; font-size: 10px; margin: 0;"
>
<img src="https://pikwizard.com/pw/medium/cd0eeb77e7c64a0bd3a7f12b80a535db.jpg" style="margin: 0; width: 100%;" alt="" />
<p style="font-size: 12px; margin: 0;">PikWizard</p>
</a>
</span>
</span>
Free (free of charge)
Free for personal and commercial use.
Author: Authentic Images
Similar Free Stock Images

Premium


Premium


Premium


Premium


Premium


Premium


Premium


Premium


Premium


Premium


Premium


Premium


Premium


Premium


Premium


Premium


Premium


Premium


Premium


Premium

Premium


Premium


Premium


Premium