- Home >
- Stock Photos >
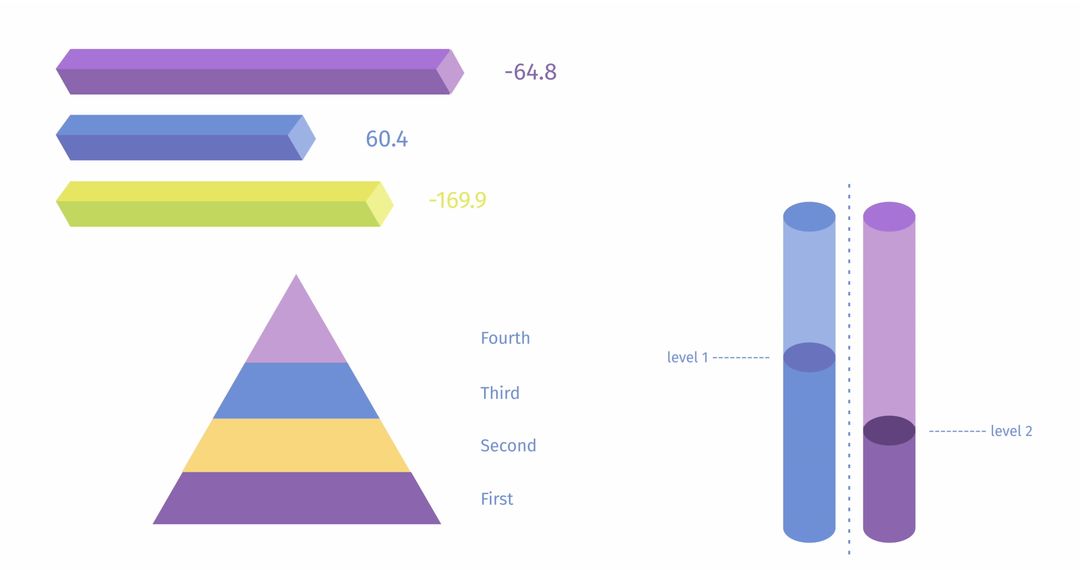
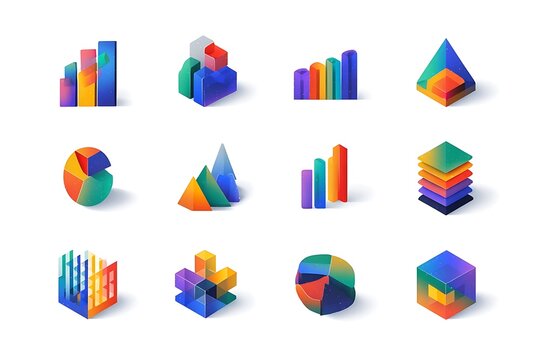
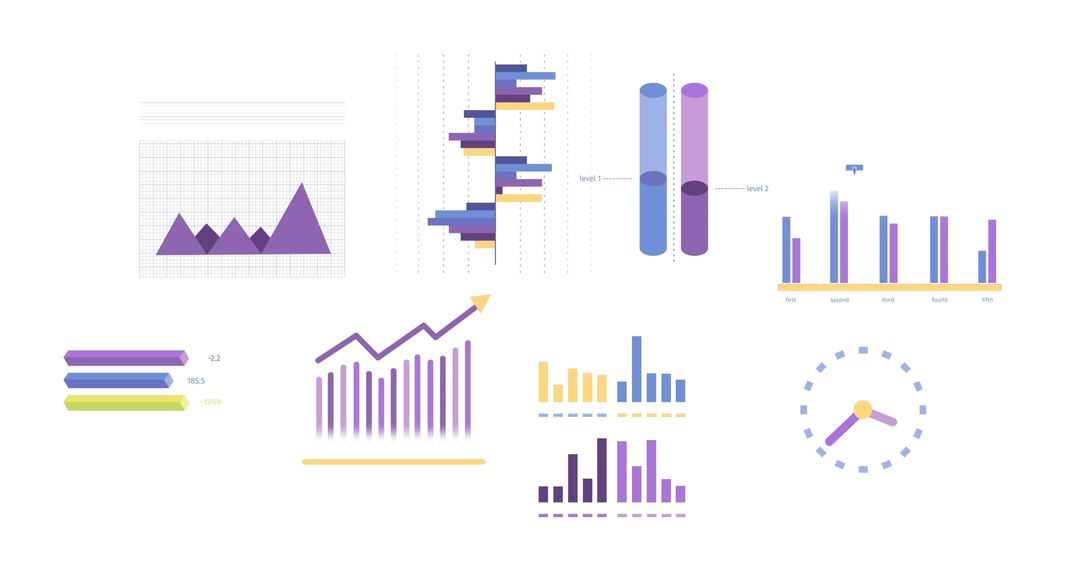
- Colorful Infographic with Data Bars and pyramid
Colorful Infographic with Data Bars and pyramid Image
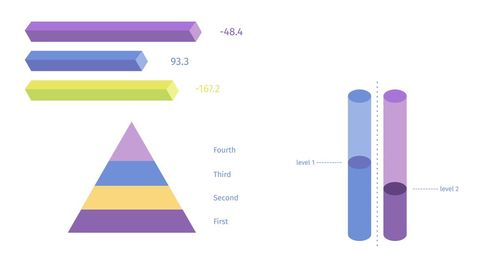
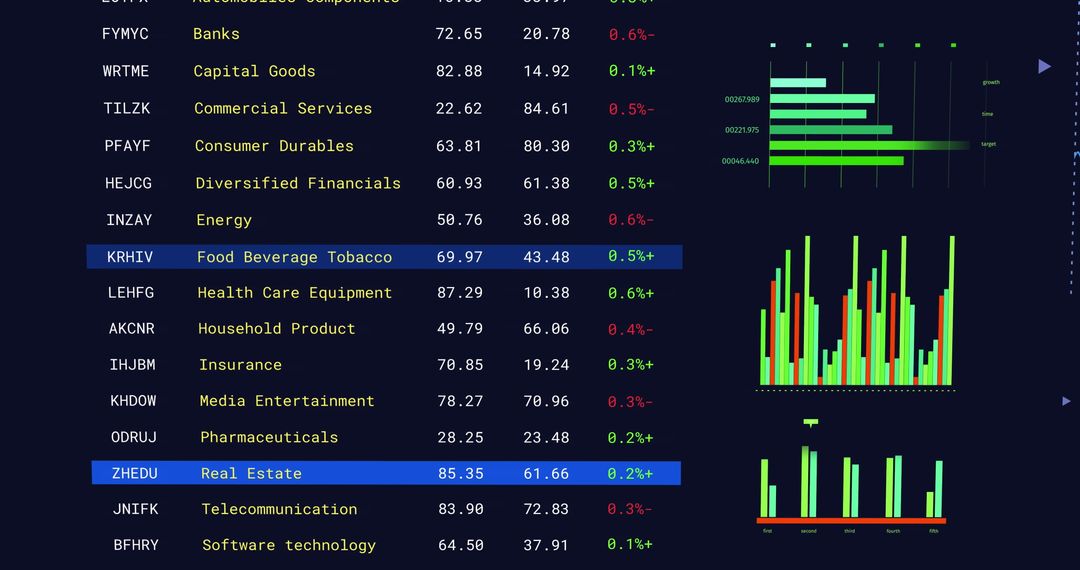
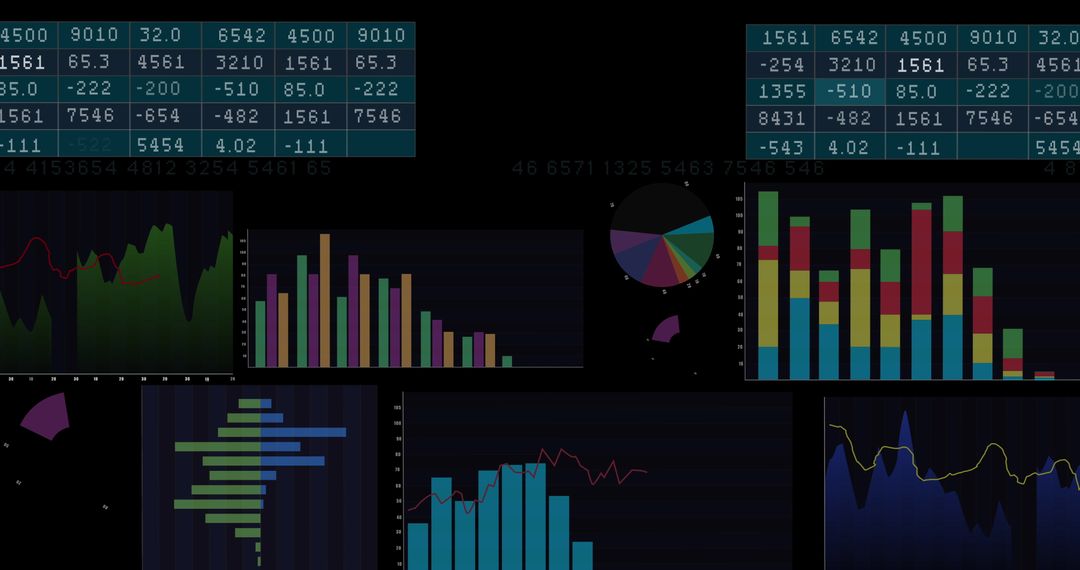
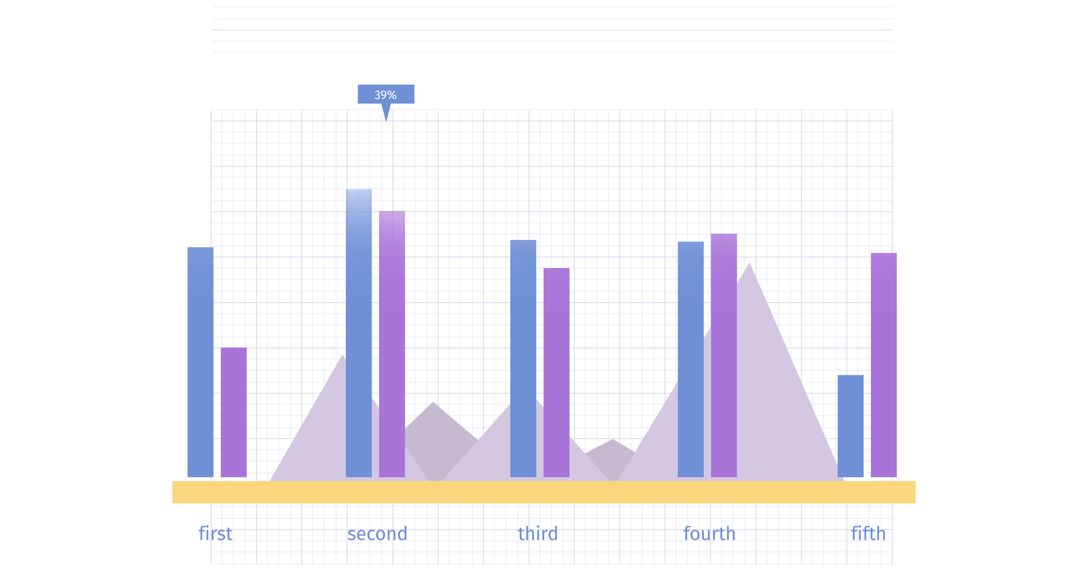
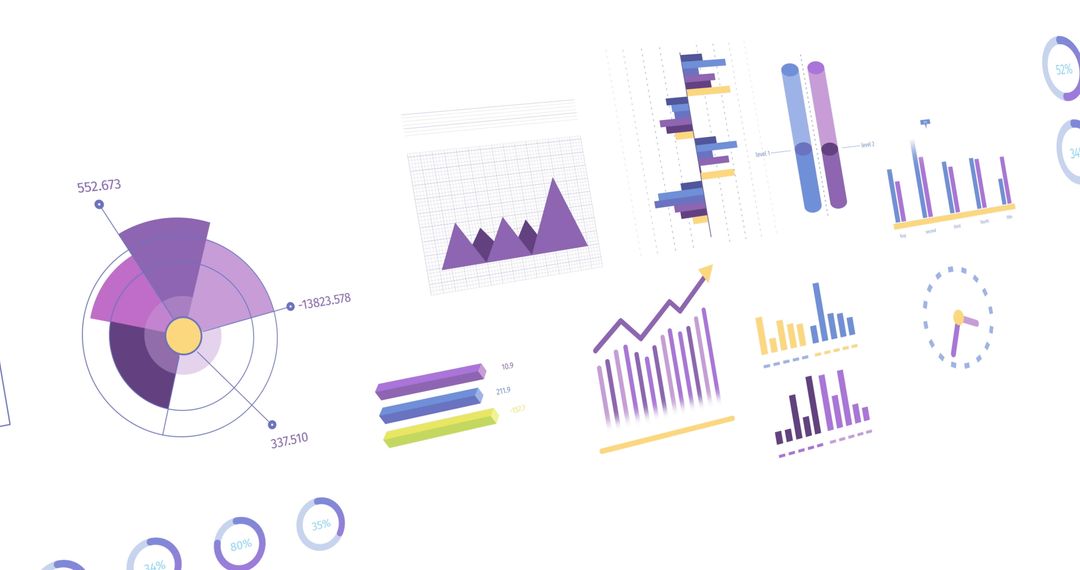
This illustration shows a variety of colorful data graphs including horizontally stacked bars, pyramid sections labeled as levels, and cylindrical shapes representing different levels. Suitable for business presentations, analytics dashboards, and technology-related reports, adding visual appeal and clarity to digital interface concepts.
Powered by 


0
downloads
downloads
Tags:
More
Credit Photo
If you would like to credit the Photo, here are some ways you can do so
Text Link
photo Link
<span class="text-link">
<span>
<a target="_blank" href=https://pikwizard.com/photo/colorful-infographic-with-data-bars-and-pyramid/277f652ed7ee7a0b4bd57a58164be7e9/>PikWizard</a>
</span>
</span>
<span class="image-link">
<span
style="margin: 0 0 20px 0; display: inline-block; vertical-align: middle; width: 100%;"
>
<a
target="_blank"
href="https://pikwizard.com/photo/colorful-infographic-with-data-bars-and-pyramid/277f652ed7ee7a0b4bd57a58164be7e9/"
style="text-decoration: none; font-size: 10px; margin: 0;"
>
<img src="https://pikwizard.com/pw/medium/277f652ed7ee7a0b4bd57a58164be7e9.jpg" style="margin: 0; width: 100%;" alt="" />
<p style="font-size: 12px; margin: 0;">PikWizard</p>
</a>
</span>
</span>
Free (free of charge)
Free for personal and commercial use.
Author: People Creations
Similar Free Stock Images

Premium


Premium


Premium


Premium


Premium


Premium


Premium


Premium


Premium


Premium


Premium


Premium


Premium


Premium


Premium


Premium


Premium


Premium


Premium


Premium


Premium


Premium


Premium


Premium