
- Home >
- Stock Photos >
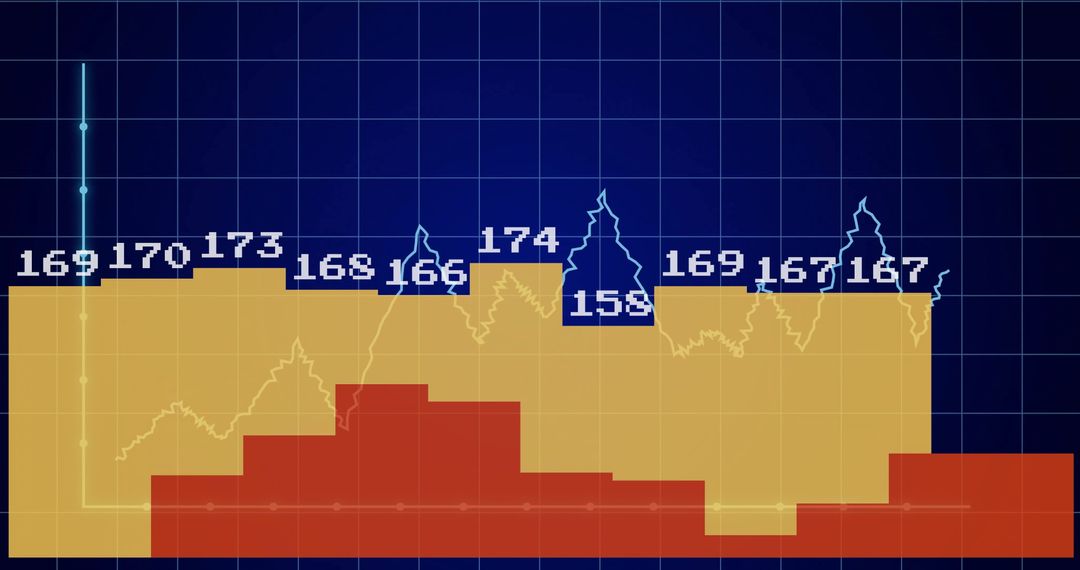
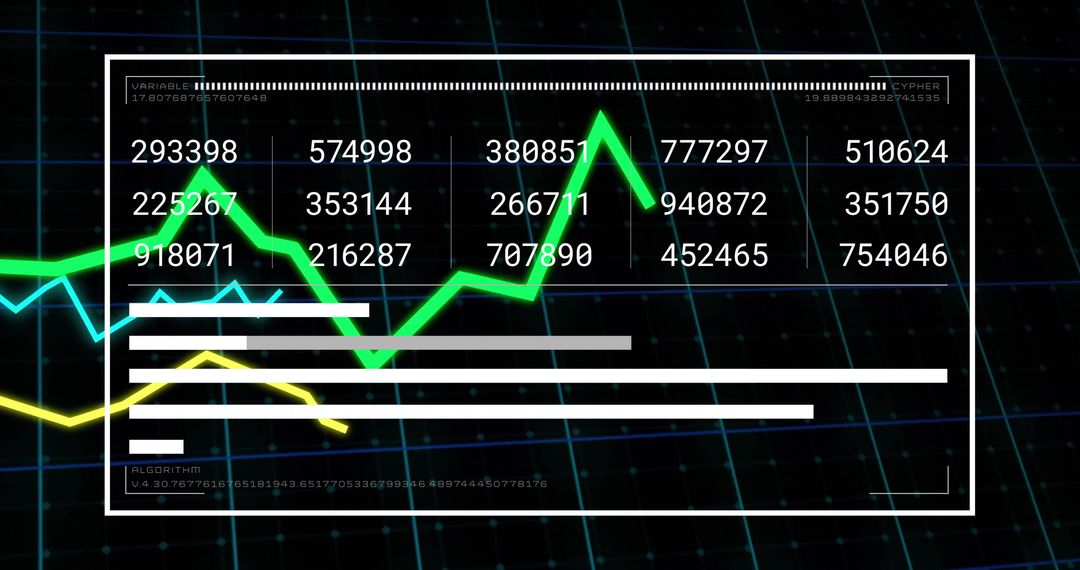
- Colorful Line Graph on Dark Grid Business Data Visualization
Colorful Line Graph on Dark Grid Business Data Visualization Image

This graphic showcases cybernetic red and whateverline graphs on a dark, gridded background accompanied by pink and orange markers. Ideal for use in presentations, financial reports, or projects focusing on data analytics, forecasting action points relation significant stakeholderncidental notation among efficiency considerations.
Powered by  - Get 15% off with code: PIKWIZARD15


0
downloads
downloads
Tags:
More
Credit Photo
If you would like to credit the Photo, here are some ways you can do so
Text Link
photo Link
<span class="text-link">
<span>
<a target="_blank" href=https://pikwizard.com/photo/colorful-line-graph-on-dark-grid-business-data-visualization/d3b93180cf7bf0256f3f28479344d515/>PikWizard</a>
</span>
</span>
<span class="image-link">
<span
style="margin: 0 0 20px 0; display: inline-block; vertical-align: middle; width: 100%;"
>
<a
target="_blank"
href="https://pikwizard.com/photo/colorful-line-graph-on-dark-grid-business-data-visualization/d3b93180cf7bf0256f3f28479344d515/"
style="text-decoration: none; font-size: 10px; margin: 0;"
>
<img src="https://pikwizard.com/pw/medium/d3b93180cf7bf0256f3f28479344d515.jpg" style="margin: 0; width: 100%;" alt="" />
<p style="font-size: 12px; margin: 0;">PikWizard</p>
</a>
</span>
</span>
Free (free of charge)
Free for personal and commercial use.
Author: Creative Art
Similar Free Stock Images

Premium


Premium


Premium


Premium


Premium


Premium


Premium


Premium


Premium


Premium


Premium


Premium


Premium


Premium


Premium


Premium


Premium


Premium


Premium


Premium


Premium


Premium


Premium


Premium

