- Home >
- Stock Photos >
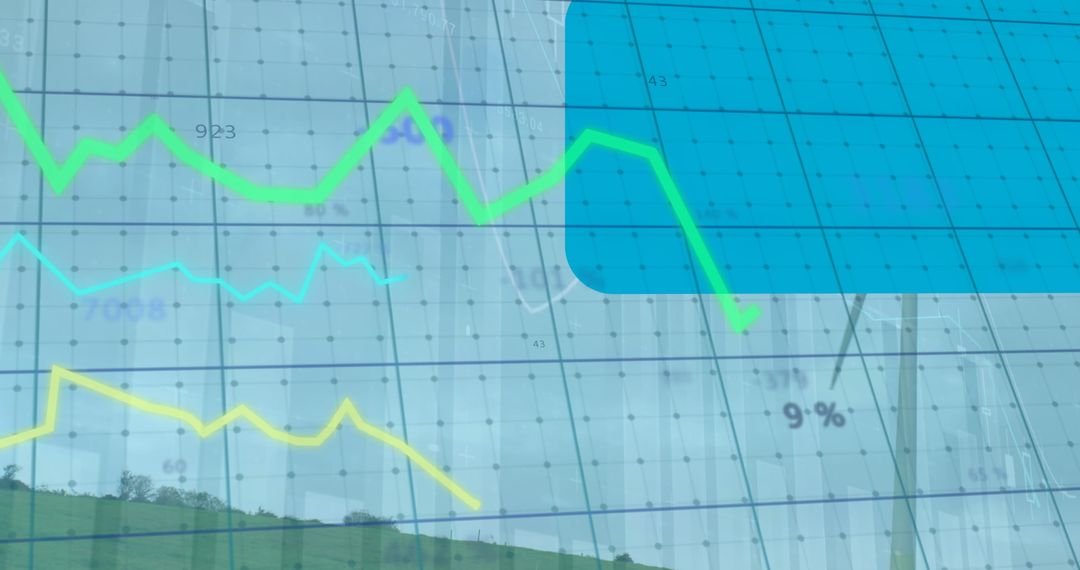
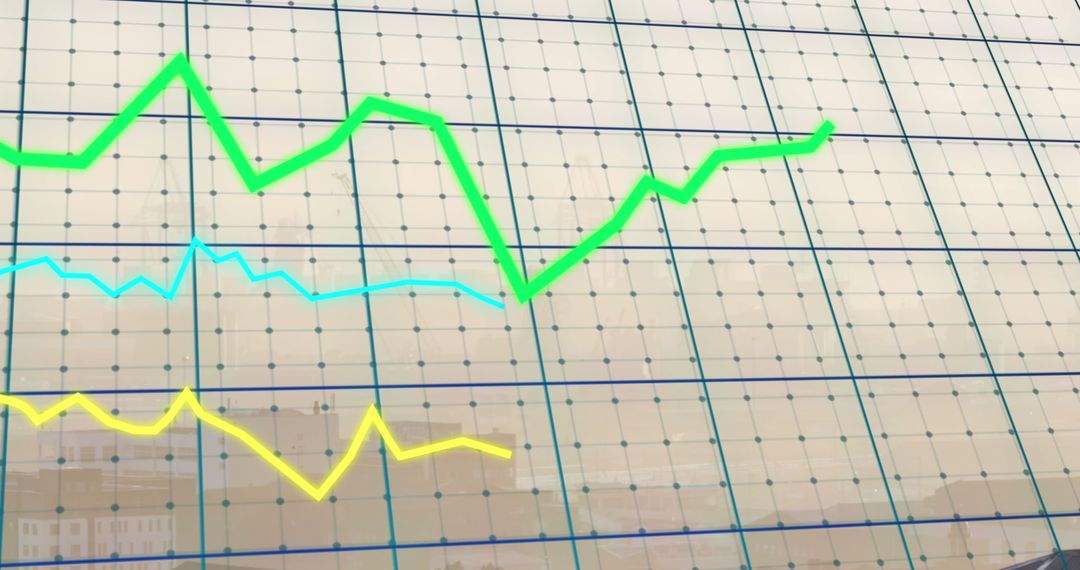
- Colorful Line Graphs Displaying Data Over City Skyline
Colorful Line Graphs Displaying Data Over City Skyline Image

This depiction of colorful line graphs over a city skyline offers a vivid representation of fluctuating data trends, blending urban aesthetics with financial analysis themes. Ideal for use in business presentations, reports, or articles about the economy, data analysis, and urban development. The integration of cityscape with dynamic line charts provides a metaphor for corporate growth and market fluctuations, making it suitable for educational and corporate scenarios
Powered by  - Get 15% off with code: PIKWIZARD15


2
downloads
downloads
Tags:
More
Credit Photo
If you would like to credit the Photo, here are some ways you can do so
Text Link
photo Link
<span class="text-link">
<span>
<a target="_blank" href=https://pikwizard.com/photo/colorful-line-graphs-displaying-data-over-city-skyline/f2b2c912f3058103b0e04ad41b29d627/>PikWizard</a>
</span>
</span>
<span class="image-link">
<span
style="margin: 0 0 20px 0; display: inline-block; vertical-align: middle; width: 100%;"
>
<a
target="_blank"
href="https://pikwizard.com/photo/colorful-line-graphs-displaying-data-over-city-skyline/f2b2c912f3058103b0e04ad41b29d627/"
style="text-decoration: none; font-size: 10px; margin: 0;"
>
<img src="https://pikwizard.com/pw/medium/f2b2c912f3058103b0e04ad41b29d627.jpg" style="margin: 0; width: 100%;" alt="" />
<p style="font-size: 12px; margin: 0;">PikWizard</p>
</a>
</span>
</span>
Free (free of charge)
Free for personal and commercial use.
Author: Creative Art
Similar Free Stock Images

Premium


Premium


Premium


Premium


Premium


Premium


Premium


Premium


Premium


Premium


Premium


Premium


Premium


Premium


Premium


Premium


Premium


Premium


Premium


Premium


Premium


Premium


Premium


Premium