- Home >
- Stock Photos >
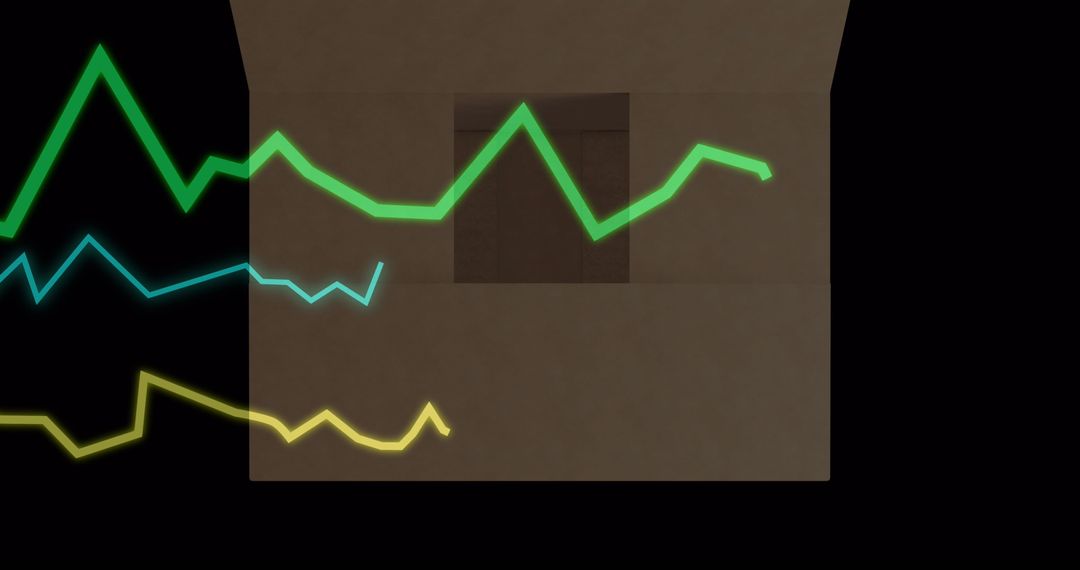
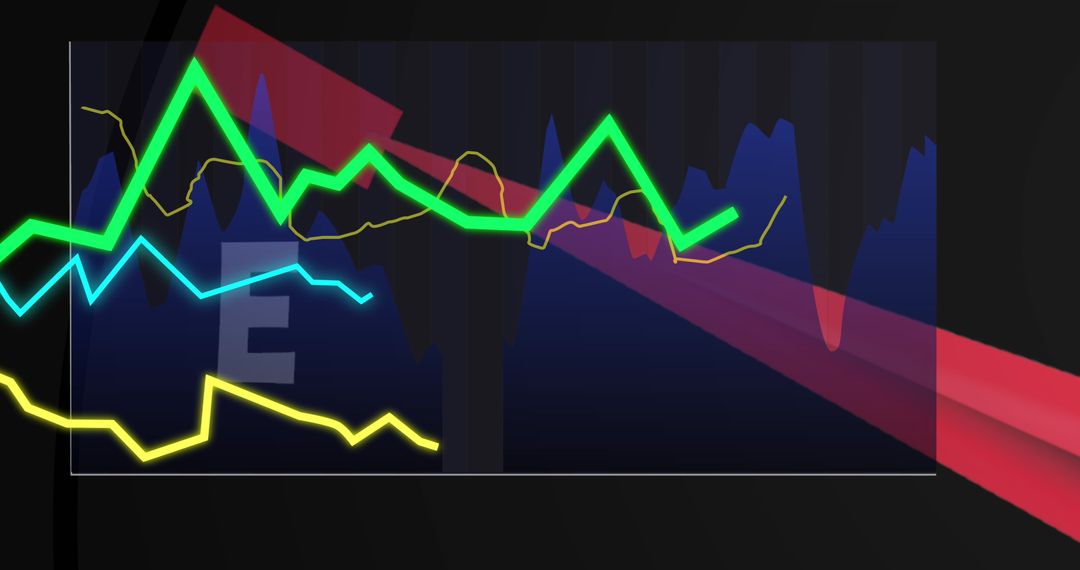
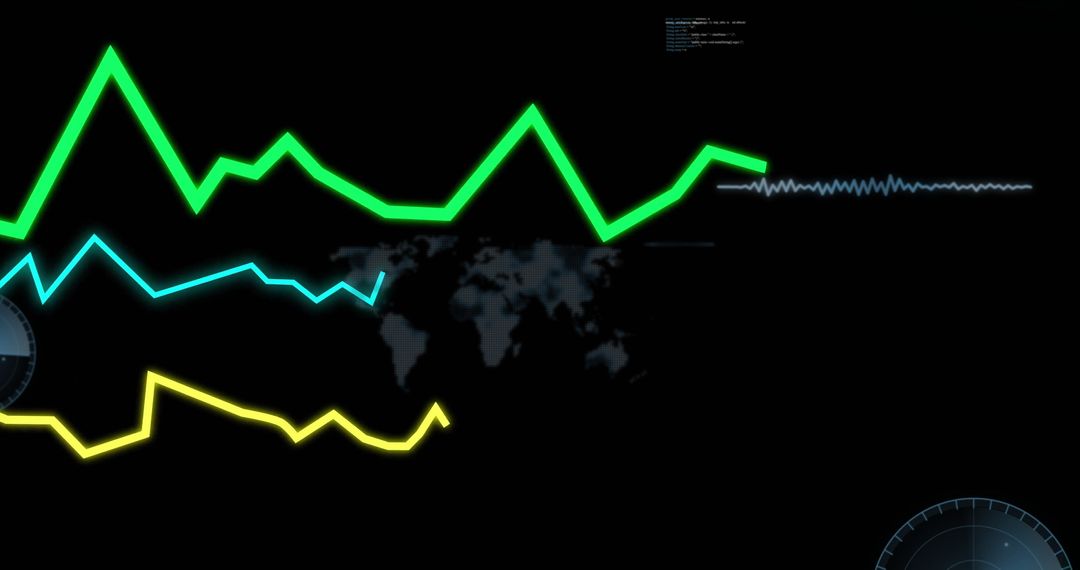
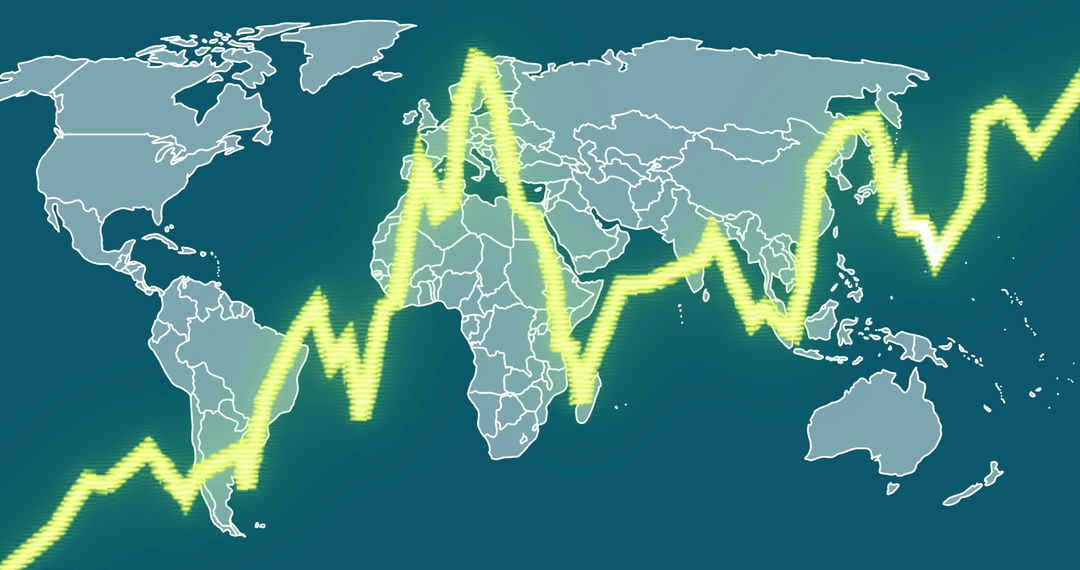
- Colorful Line Graphs on Dark World Map Background
Colorful Line Graphs on Dark World Map Background Image

Dynamic visualization showing jagged lines in green, cyan, and yellow crossing over a dark, indistinct world map. Represents analytics, global data, and technology integration in presentations, reports, and infographics. Useful for illustrating trends or tech-focused business concepts.
Powered by 


0
downloads
downloads
Tags:
More
Credit Photo
If you would like to credit the Photo, here are some ways you can do so
Text Link
photo Link
<span class="text-link">
<span>
<a target="_blank" href=https://pikwizard.com/photo/colorful-line-graphs-on-dark-world-map-background/62b5e0febf0939fec9f193c8c09f7a10/>PikWizard</a>
</span>
</span>
<span class="image-link">
<span
style="margin: 0 0 20px 0; display: inline-block; vertical-align: middle; width: 100%;"
>
<a
target="_blank"
href="https://pikwizard.com/photo/colorful-line-graphs-on-dark-world-map-background/62b5e0febf0939fec9f193c8c09f7a10/"
style="text-decoration: none; font-size: 10px; margin: 0;"
>
<img src="https://pikwizard.com/pw/medium/62b5e0febf0939fec9f193c8c09f7a10.jpg" style="margin: 0; width: 100%;" alt="" />
<p style="font-size: 12px; margin: 0;">PikWizard</p>
</a>
</span>
</span>
Free (free of charge)
Free for personal and commercial use.
Author: People Creations
Similar Free Stock Images

Premium


Premium


Premium


Premium


Premium


Premium


Premium


Premium


Premium


Premium


Premium


Premium


Premium


Premium


Premium


Premium


Premium


Premium


Premium


Premium


Premium


Premium


Premium


Premium