- Home >
- Stock Photos >
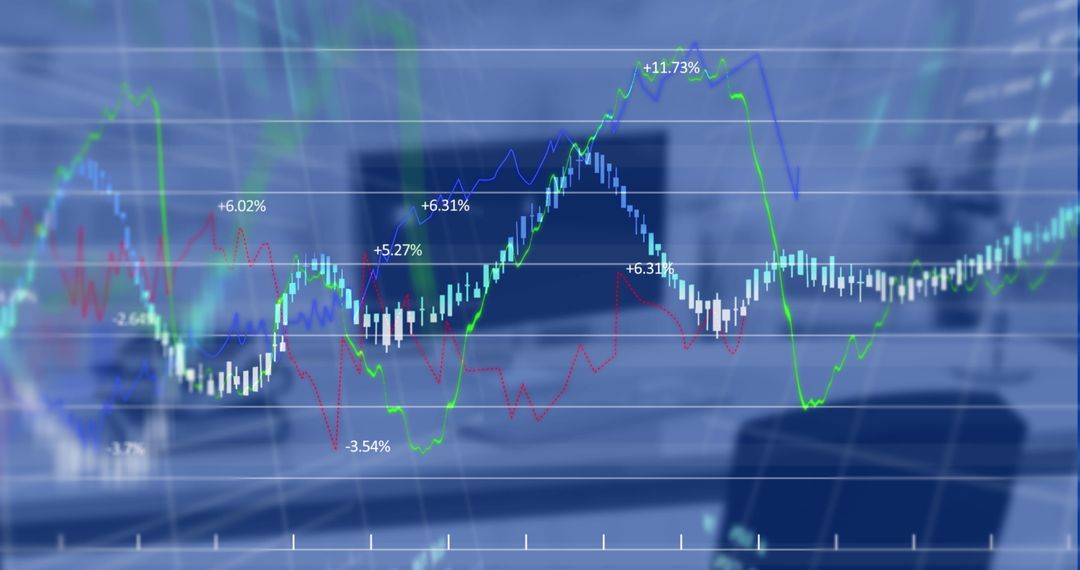
- Colorful Line Graphs on Digital Display in Control Room
Colorful Line Graphs on Digital Display in Control Room Image

Graphs in dimly lit control room signify advanced technology workspaces. Ideal for illustrating tech innovation and data analysis concepts.
Powered by 


0
downloads
downloads
Tags:
More
Credit Photo
If you would like to credit the Photo, here are some ways you can do so
Text Link
photo Link
<span class="text-link">
<span>
<a target="_blank" href=https://pikwizard.com/photo/colorful-line-graphs-on-digital-display-in-control-room/e7ef28224b1517458f25cbc2909d64ec/>PikWizard</a>
</span>
</span>
<span class="image-link">
<span
style="margin: 0 0 20px 0; display: inline-block; vertical-align: middle; width: 100%;"
>
<a
target="_blank"
href="https://pikwizard.com/photo/colorful-line-graphs-on-digital-display-in-control-room/e7ef28224b1517458f25cbc2909d64ec/"
style="text-decoration: none; font-size: 10px; margin: 0;"
>
<img src="https://pikwizard.com/pw/medium/e7ef28224b1517458f25cbc2909d64ec.jpg" style="margin: 0; width: 100%;" alt="" />
<p style="font-size: 12px; margin: 0;">PikWizard</p>
</a>
</span>
</span>
Free (free of charge)
Free for personal and commercial use.
Author: Awesome Content
Similar Free Stock Images

Premium


Premium


Premium


Premium


Premium


Premium


Premium


Premium


Premium


Premium


Premium


Premium


Premium


Premium


Premium


Premium


Premium


Premium


Premium


Premium


Premium


Premium


Premium


Premium