- Home >
- Stock Photos >
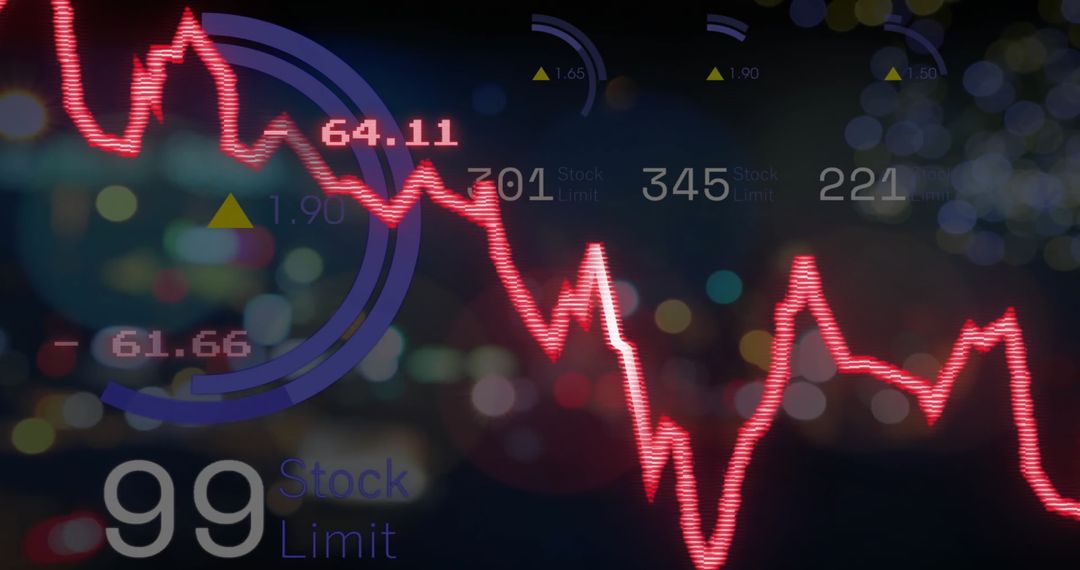
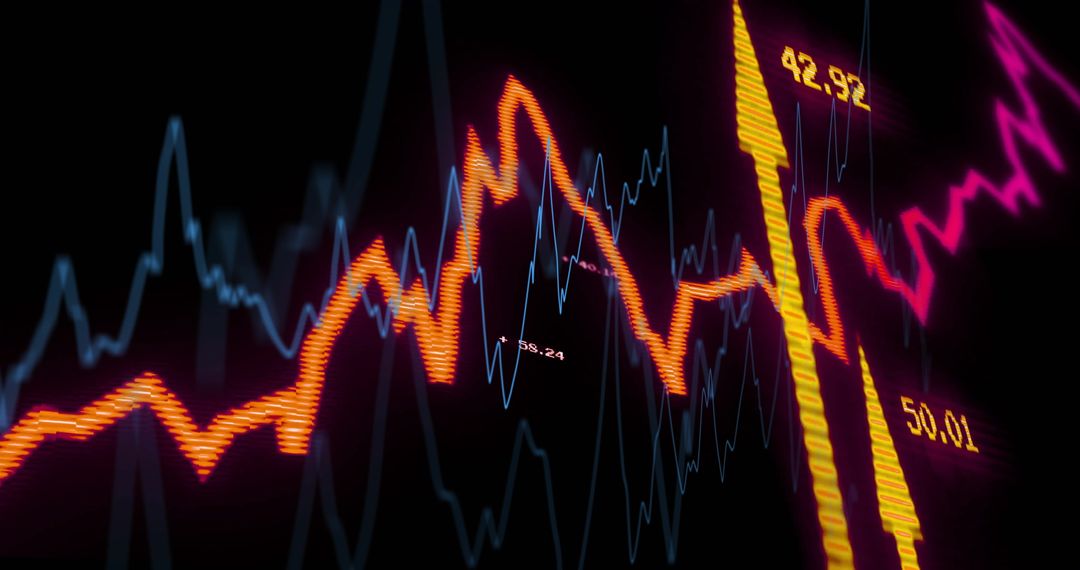
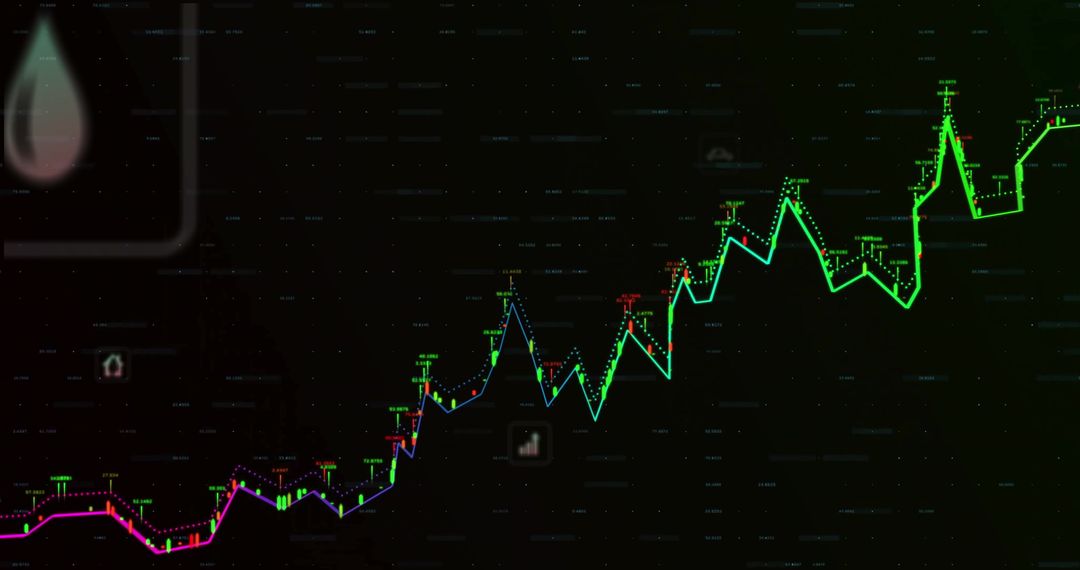
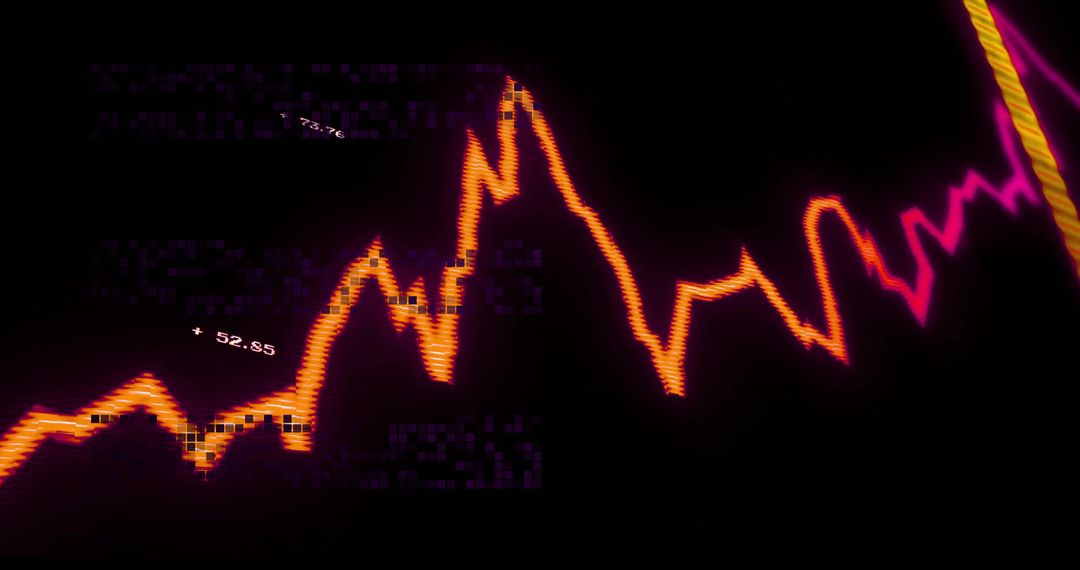
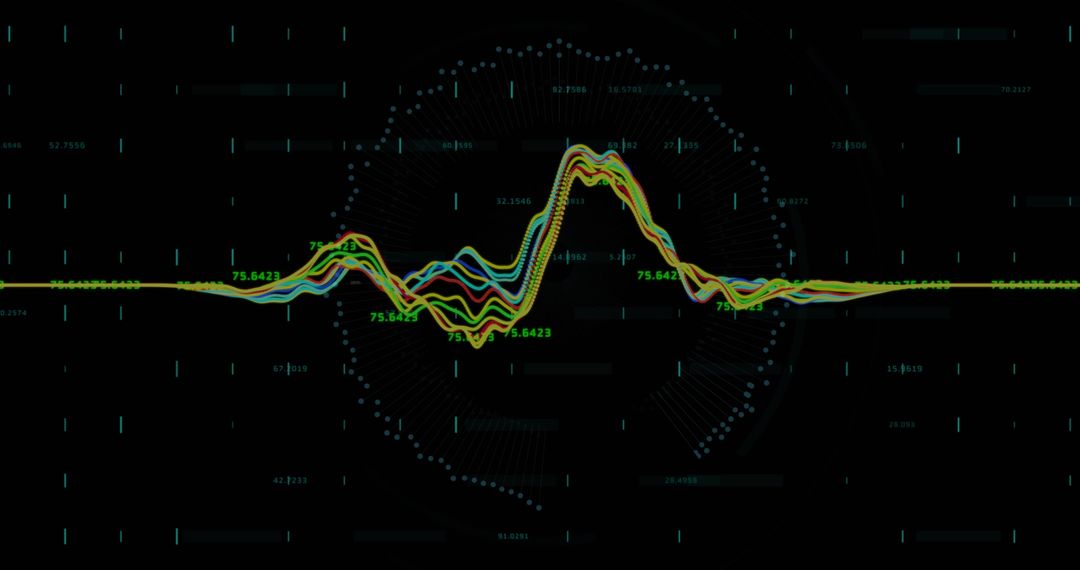
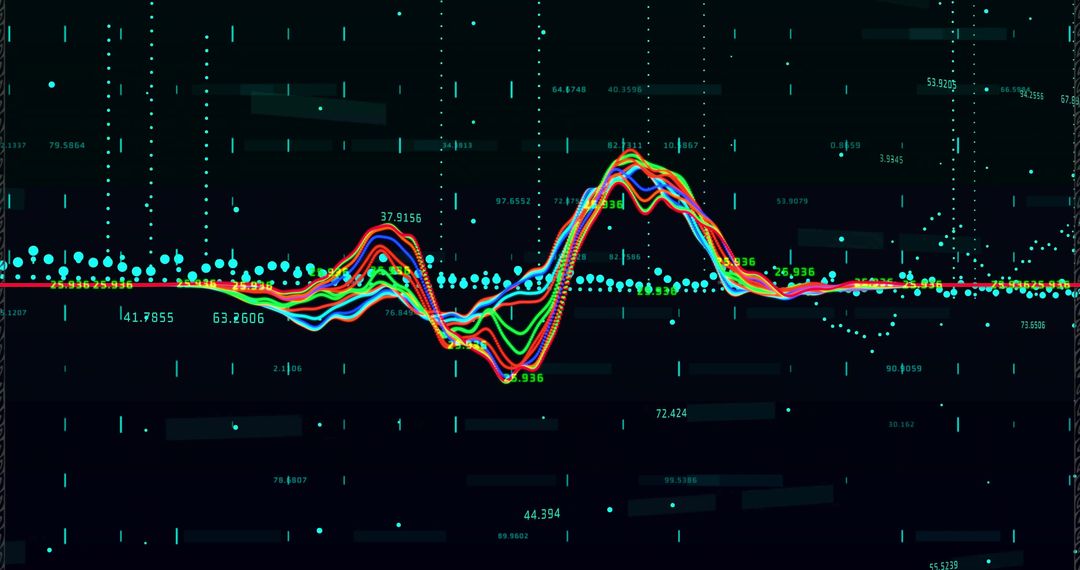
- Colorful Line Graphs with Candlestick Markers on Digital Interface
Colorful Line Graphs with Candlestick Markers on Digital Interface Image

Vibrant line graphs including candlestick markers appearing on digital interface focus on trends, possible usage in financial articles tuition making presentation materials. Suitable boosting reader connection digital age.
Powered by  - Get 15% off with code: PIKWIZARD15


0
downloads
downloads
Tags:
More
Credit Photo
If you would like to credit the Photo, here are some ways you can do so
Text Link
photo Link
<span class="text-link">
<span>
<a target="_blank" href=https://pikwizard.com/photo/colorful-line-graphs-with-candlestick-markers-on-digital-interface/3bedfa8dd37750288c9a4eae354077c7/>PikWizard</a>
</span>
</span>
<span class="image-link">
<span
style="margin: 0 0 20px 0; display: inline-block; vertical-align: middle; width: 100%;"
>
<a
target="_blank"
href="https://pikwizard.com/photo/colorful-line-graphs-with-candlestick-markers-on-digital-interface/3bedfa8dd37750288c9a4eae354077c7/"
style="text-decoration: none; font-size: 10px; margin: 0;"
>
<img src="https://pikwizard.com/pw/medium/3bedfa8dd37750288c9a4eae354077c7.jpg" style="margin: 0; width: 100%;" alt="" />
<p style="font-size: 12px; margin: 0;">PikWizard</p>
</a>
</span>
</span>
Free (free of charge)
Free for personal and commercial use.
Author: People Creations