- Home >
- Stock Photos >
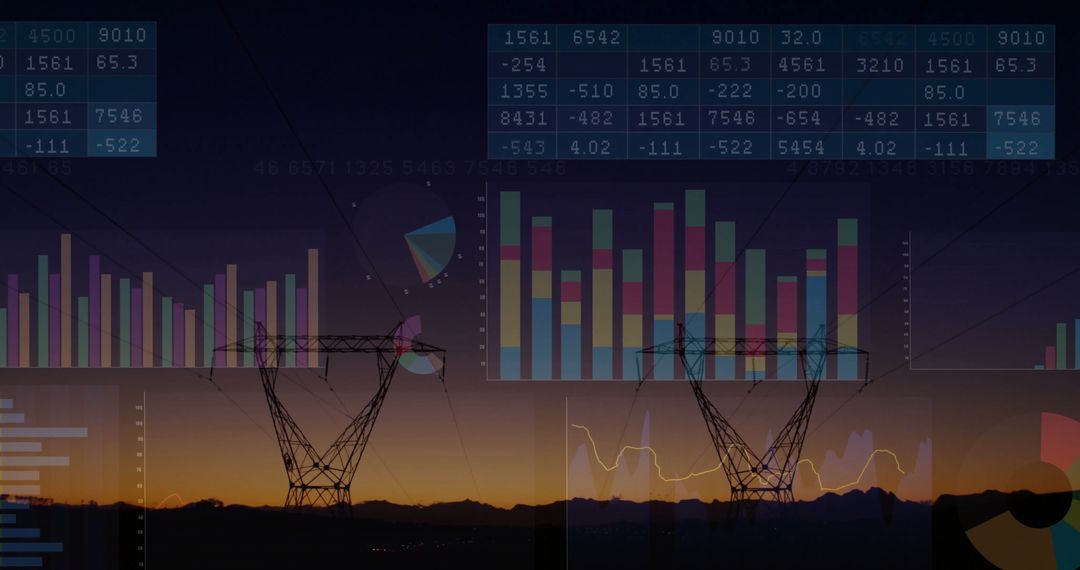
- Colorful Mixed Graphs and Charts on Abstract Background
Colorful Mixed Graphs and Charts on Abstract Background Image

Colorful mixed data, focusing on advanced analytics and business intelligence, brings abstract reporting to life. Useful for articles on data science, business analysis, corporate reports, or as a vibrant, dynamic element in presentations.
Powered by  - Get 15% off with code: PIKWIZARD15


2
downloads
downloads
Tags:
More
Credit Photo
If you would like to credit the Photo, here are some ways you can do so
Text Link
photo Link
<span class="text-link">
<span>
<a target="_blank" href=https://pikwizard.com/photo/colorful-mixed-graphs-and-charts-on-abstract-background/15c7c0fd39c4749953c8ffbc459b0be9/>PikWizard</a>
</span>
</span>
<span class="image-link">
<span
style="margin: 0 0 20px 0; display: inline-block; vertical-align: middle; width: 100%;"
>
<a
target="_blank"
href="https://pikwizard.com/photo/colorful-mixed-graphs-and-charts-on-abstract-background/15c7c0fd39c4749953c8ffbc459b0be9/"
style="text-decoration: none; font-size: 10px; margin: 0;"
>
<img src="https://pikwizard.com/pw/medium/15c7c0fd39c4749953c8ffbc459b0be9.jpg" style="margin: 0; width: 100%;" alt="" />
<p style="font-size: 12px; margin: 0;">PikWizard</p>
</a>
</span>
</span>
Free (free of charge)
Free for personal and commercial use.
Author: Awesome Content
Similar Free Stock Images

Premium


Premium


Premium


Premium


Premium


Premium


Premium


Premium


Premium


Premium


Premium


Premium


Premium


Premium


Premium


Premium


Premium


Premium


Premium


Premium


Premium


Premium


Premium


Premium