- Home >
- Stock Photos >
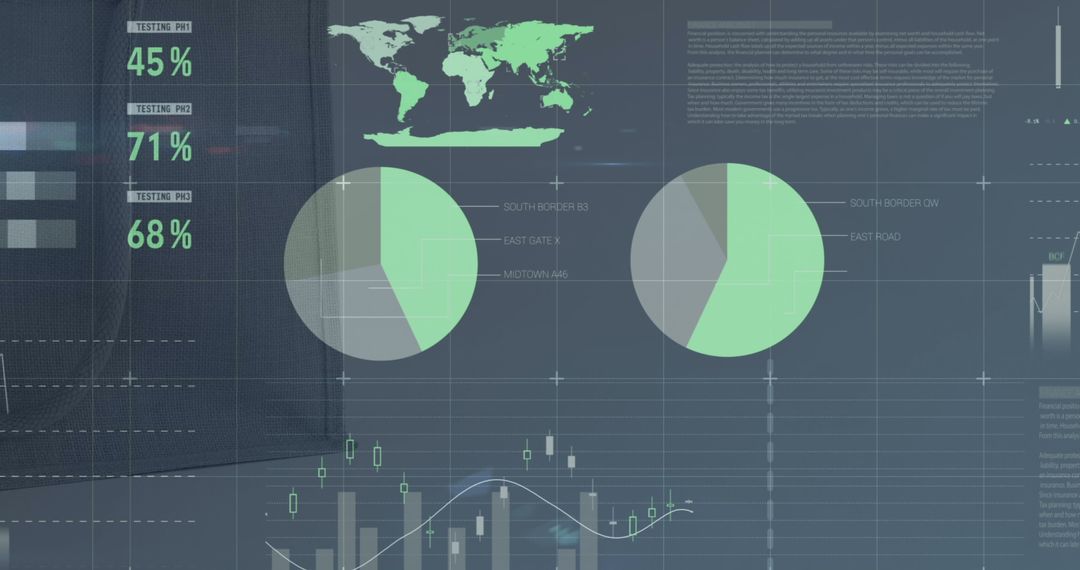
- Colorful Pie Charts and Graphs for Digital Data Analysis Presentation
Colorful Pie Charts and Graphs for Digital Data Analysis Presentation Image

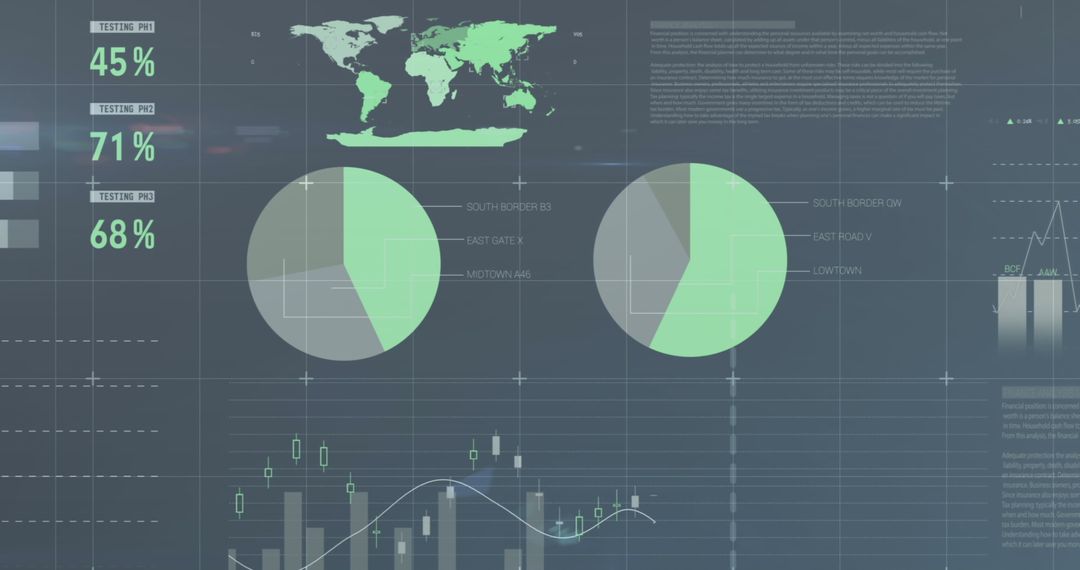
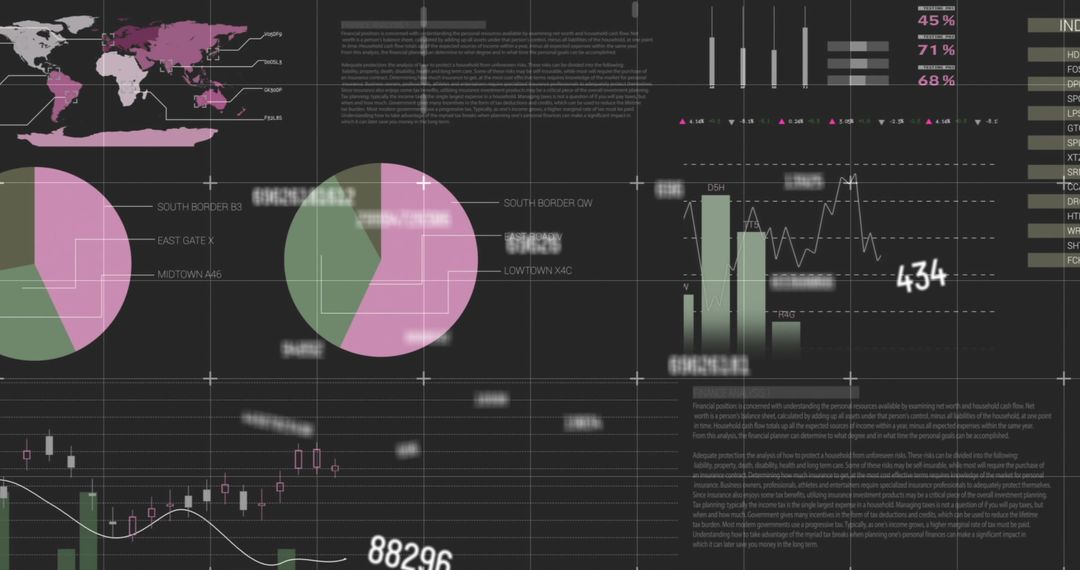
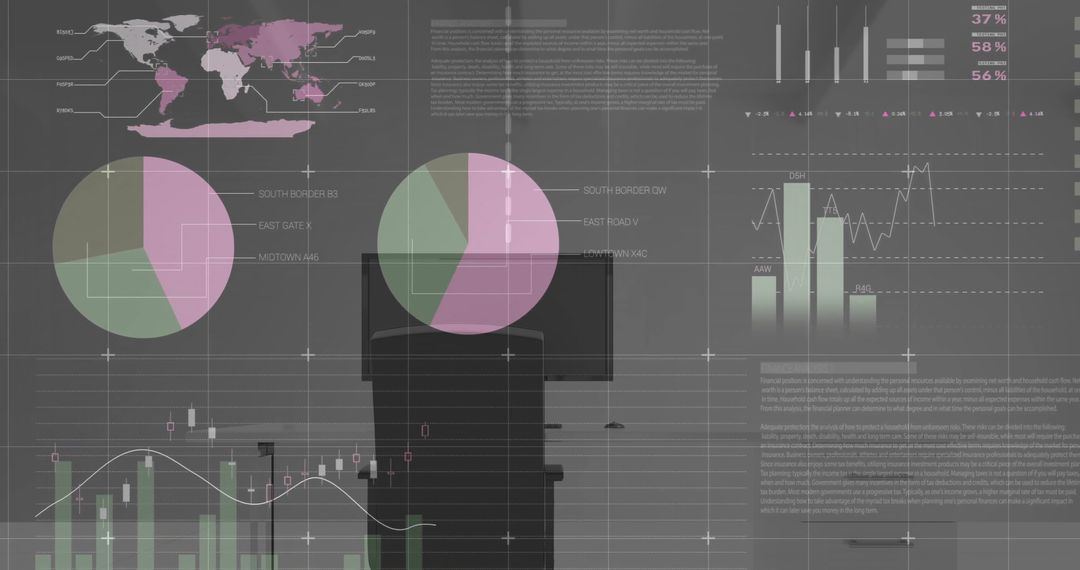
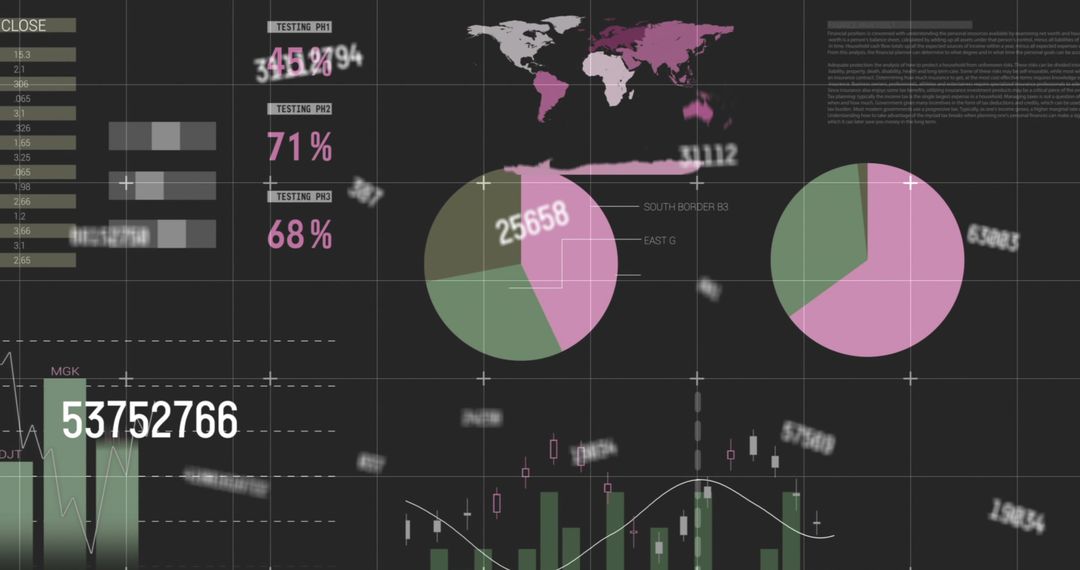
Dynamic representation of colorful pie charts and graphs illustrates detailed data analysis ideally for use in presentations, reports, or infographics. Suited for business professionals and analysts who require creative and engaging visuals to represent complex statistical data in an easily digestible manner, especially in finance and technology sectors.
Powered by  - Get 15% off with code: PIKWIZARD15


2
downloads
downloads
Tags:
More
Credit Photo
If you would like to credit the Photo, here are some ways you can do so
Text Link
photo Link
<span class="text-link">
<span>
<a target="_blank" href=https://pikwizard.com/photo/colorful-pie-charts-and-graphs-for-digital-data-analysis-presentation/65364d5ab6863b0a4970152a3af3fada/>PikWizard</a>
</span>
</span>
<span class="image-link">
<span
style="margin: 0 0 20px 0; display: inline-block; vertical-align: middle; width: 100%;"
>
<a
target="_blank"
href="https://pikwizard.com/photo/colorful-pie-charts-and-graphs-for-digital-data-analysis-presentation/65364d5ab6863b0a4970152a3af3fada/"
style="text-decoration: none; font-size: 10px; margin: 0;"
>
<img src="https://pikwizard.com/pw/medium/65364d5ab6863b0a4970152a3af3fada.jpg" style="margin: 0; width: 100%;" alt="" />
<p style="font-size: 12px; margin: 0;">PikWizard</p>
</a>
</span>
</span>
Free (free of charge)
Free for personal and commercial use.
Author: Authentic Images
Similar Free Stock Images

Premium


Premium


Premium


Premium


Premium


Premium


Premium


Premium


Premium


Premium


Premium


Premium


Premium


Premium


Premium


Premium


Premium


Premium


Premium


Premium


Premium


Premium


Premium


Premium