
- Home >
- Stock Photos >
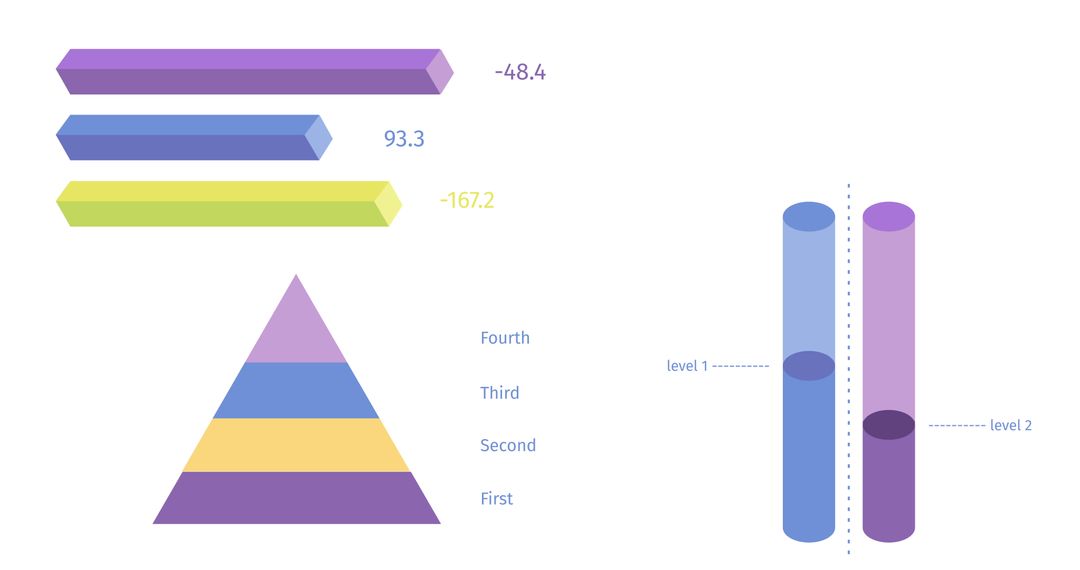
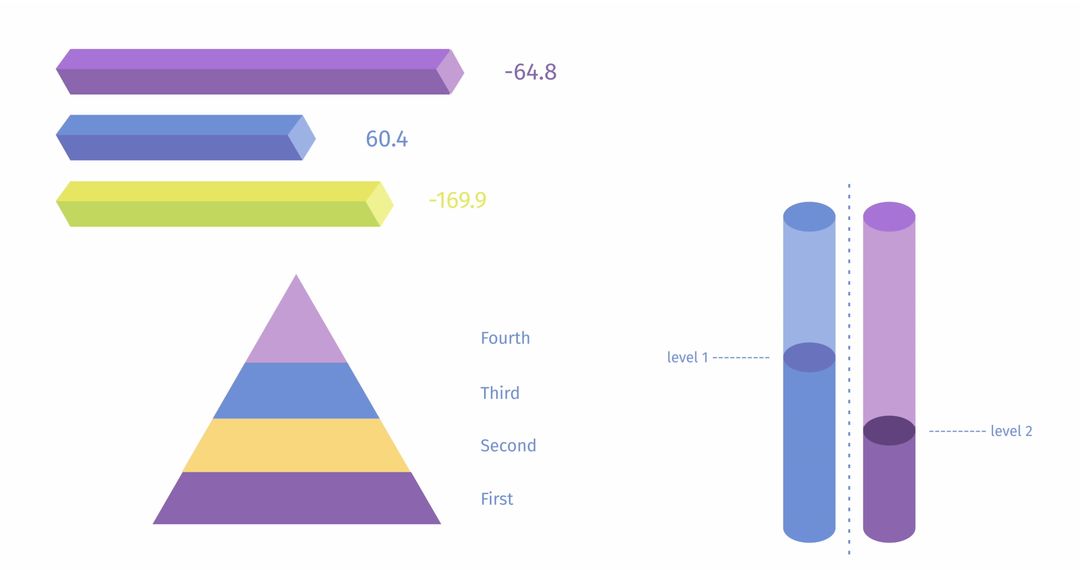
- Colorful Pie Charts and Graphs on White Background
Colorful Pie Charts and Graphs on White Background Image

Visualizing various colorful pie charts and graphs on a white background, representing data processing and digital interface concepts. Useful for illustrating business analytics, financial reports, statistical data analysis, presentations on information technology, and digital transformation initiatives.
Powered by  - Get 15% off with code: PIKWIZARD15


4
downloads
downloads
Tags:
More
Credit Photo
If you would like to credit the Photo, here are some ways you can do so
Text Link
photo Link
<span class="text-link">
<span>
<a target="_blank" href=https://pikwizard.com/photo/colorful-pie-charts-and-graphs-on-white-background/8712fca843b70c7aa5aeafec9efc7eeb/>PikWizard</a>
</span>
</span>
<span class="image-link">
<span
style="margin: 0 0 20px 0; display: inline-block; vertical-align: middle; width: 100%;"
>
<a
target="_blank"
href="https://pikwizard.com/photo/colorful-pie-charts-and-graphs-on-white-background/8712fca843b70c7aa5aeafec9efc7eeb/"
style="text-decoration: none; font-size: 10px; margin: 0;"
>
<img src="https://pikwizard.com/pw/medium/8712fca843b70c7aa5aeafec9efc7eeb.jpg" style="margin: 0; width: 100%;" alt="" />
<p style="font-size: 12px; margin: 0;">PikWizard</p>
</a>
</span>
</span>
Free (free of charge)
Free for personal and commercial use.
Author: Awesome Content
Similar Free Stock Images

Premium


Premium


Premium


Premium


Premium


Premium


Premium


Premium


Premium


Premium


Premium


Premium


Premium


Premium


Premium


Premium


Premium


Premium


Premium


Premium


Premium


Premium


Premium


Premium

