
- Home >
- Stock Photos >
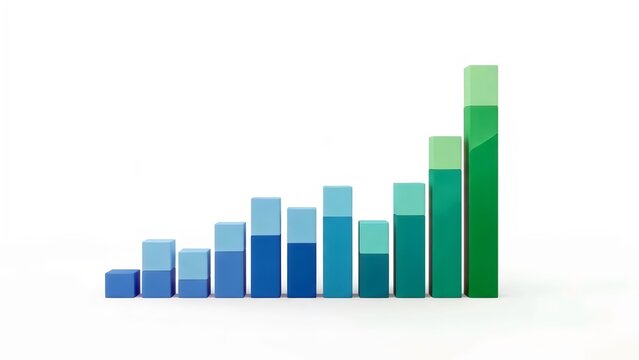
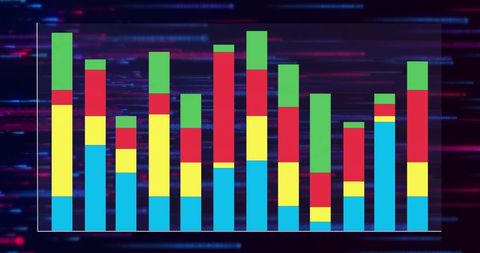
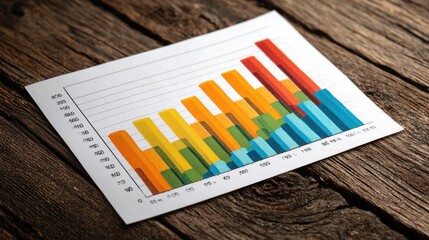
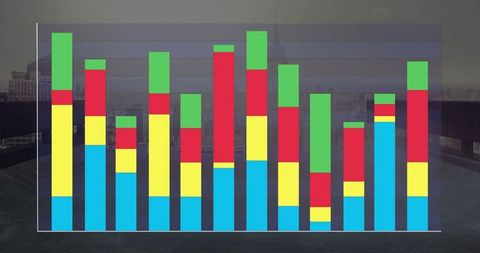
- Colorful Stacked Bar Chart with Data Analysis Elements
Colorful Stacked Bar Chart with Data Analysis Elements Image

Visually engaging stacked bar chart integrates multiple colors to depict diverse data segments, overlaying charts and data interfaces. Ideal for presentations involving financial analysis, data interpretation, and reports. Use for infographics showcasing business trends and statistical reviews.
Powered by 


downloads
Tags:
More
Credit Photo
If you would like to credit the Photo, here are some ways you can do so
Text Link
photo Link
<span class="text-link">
<span>
<a target="_blank" href=https://pikwizard.com/photo/colorful-stacked-bar-chart-with-data-analysis-elements/1336f9145565b2b40bc4d71b11398ecf/>PikWizard</a>
</span>
</span>
<span class="image-link">
<span
style="margin: 0 0 20px 0; display: inline-block; vertical-align: middle; width: 100%;"
>
<a
target="_blank"
href="https://pikwizard.com/photo/colorful-stacked-bar-chart-with-data-analysis-elements/1336f9145565b2b40bc4d71b11398ecf/"
style="text-decoration: none; font-size: 10px; margin: 0;"
>
<img src="https://pikwizard.com/pw/medium/1336f9145565b2b40bc4d71b11398ecf.jpg" style="margin: 0; width: 100%;" alt="" />
<p style="font-size: 12px; margin: 0;">PikWizard</p>
</a>
</span>
</span>
Free (free of charge)
Free for personal and commercial use.
Author: Awesome Content
Similar Free Stock Images

Premium


Premium


Premium


Premium


Premium

Premium


Premium


Premium

Premium

Premium


Premium


Premium


Premium


Premium

Premium


Premium


Premium


Premium

Premium


Premium
Premium


Premium


Premium


Premium


Premium

Explore More Free Stock Images