- Home >
- Stock Photos >
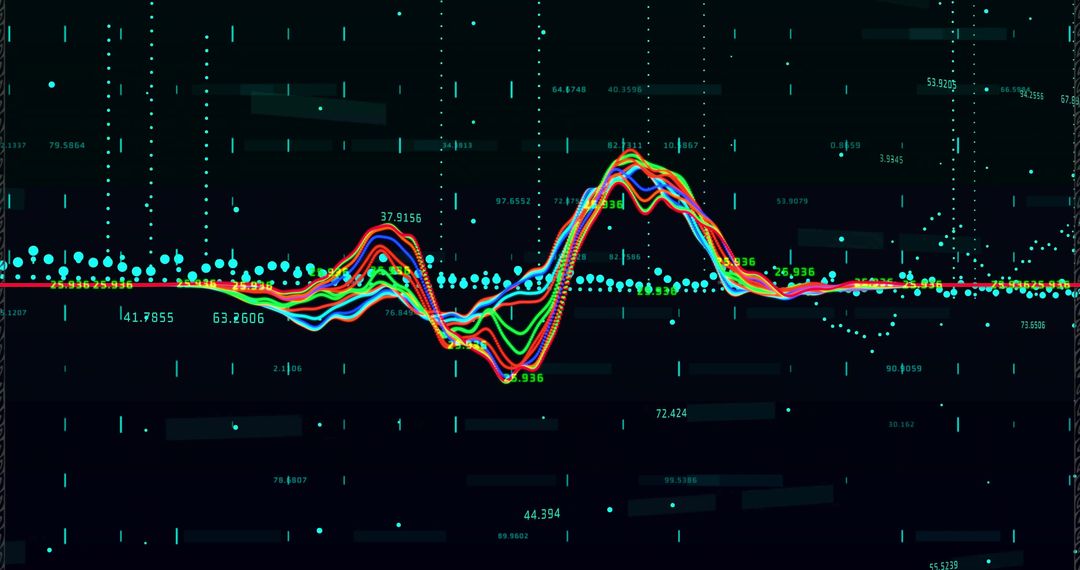
- Colorful Stock Market Graph on Digital Grid Background
Colorful Stock Market Graph on Digital Grid Background Image

Graph represents dynamic changes in stock prices, ideal for illustrating financial market trends. Perfect for financial presentations, articles on global economy, and educational materials about investing.
Powered by 


2
downloads
downloads
Tags:
More
Credit Photo
If you would like to credit the Photo, here are some ways you can do so
Text Link
photo Link
<span class="text-link">
<span>
<a target="_blank" href=https://pikwizard.com/photo/colorful-stock-market-graph-on-digital-grid-background/ed62d4a70c09e4bc6ee21a0a7e1a7ecc/>PikWizard</a>
</span>
</span>
<span class="image-link">
<span
style="margin: 0 0 20px 0; display: inline-block; vertical-align: middle; width: 100%;"
>
<a
target="_blank"
href="https://pikwizard.com/photo/colorful-stock-market-graph-on-digital-grid-background/ed62d4a70c09e4bc6ee21a0a7e1a7ecc/"
style="text-decoration: none; font-size: 10px; margin: 0;"
>
<img src="https://pikwizard.com/pw/medium/ed62d4a70c09e4bc6ee21a0a7e1a7ecc.jpg" style="margin: 0; width: 100%;" alt="" />
<p style="font-size: 12px; margin: 0;">PikWizard</p>
</a>
</span>
</span>
Free (free of charge)
Free for personal and commercial use.
Author: Awesome Content
Similar Free Stock Images

Premium


Premium


Premium


Premium


Premium


Premium


Premium


Premium


Premium


Premium


Premium


Premium


Premium


Premium


Premium


Premium


Premium


Premium


Premium


Premium


Premium


Premium


Premium


Premium