
- Home >
- Stock Photos >
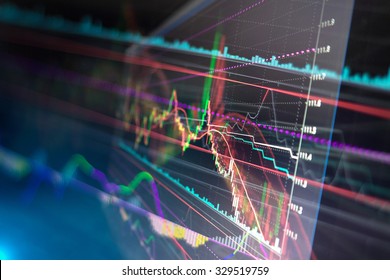
- Colorful Stock Market Graph with LED Display Style
Colorful Stock Market Graph with LED Display Style Image

Bright and colorful digital graph with glowing numbers showcases a vivid representation of stock market trends, ideal for business and finance content, global economy analyses, and technology-driven financial discussions.
Powered by  - Get 15% off with code: PIKWIZARD15


downloads
Tags:
More
Credit Photo
If you would like to credit the Photo, here are some ways you can do so
Text Link
photo Link
<span class="text-link">
<span>
<a target="_blank" href=https://pikwizard.com/photo/colorful-stock-market-graph-with-led-display-style/dc24facd603c08f01fbeb0b4e0653910/>PikWizard</a>
</span>
</span>
<span class="image-link">
<span
style="margin: 0 0 20px 0; display: inline-block; vertical-align: middle; width: 100%;"
>
<a
target="_blank"
href="https://pikwizard.com/photo/colorful-stock-market-graph-with-led-display-style/dc24facd603c08f01fbeb0b4e0653910/"
style="text-decoration: none; font-size: 10px; margin: 0;"
>
<img src="https://pikwizard.com/pw/medium/dc24facd603c08f01fbeb0b4e0653910.jpg" style="margin: 0; width: 100%;" alt="" />
<p style="font-size: 12px; margin: 0;">PikWizard</p>
</a>
</span>
</span>
Free (free of charge)
Free for personal and commercial use.
Author: Creative Art
Similar Free Stock Images
Loading...

Premium


Premium

Premium


Premium


Premium


Premium


Premium


Premium

Premium

Premium

Premium


Premium


Premium

Premium

Premium


Premium

Premium


Premium

Premium


Premium
Premium


Premium


Premium


Premium

Premium


