1. Home > 
  2. Stock Photos > 
  3. Colorful Stock Performance Graph on Blue Grid Screen

Colorful Stock Performance Graph on Blue Grid Screen Image

Colorful Stock Performance Graph on Blue Grid Screen

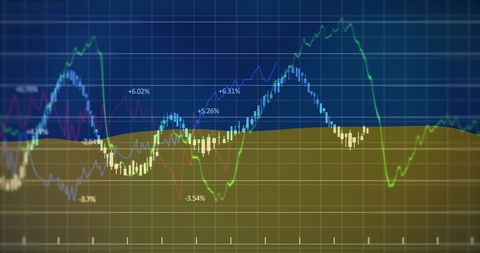
This image displays multiple colorful lines on a grid, representing different stock performances over time. Each line varies, showcasing trends and shifts in the financial market. It is ideal for illustrating concepts in financial analysis, market tracking, and investment strategies. Suitable for use in presentations, reports, or educational materials about economic trends.

Powered by Shutterstock logo - Get 15% off with code: PIKWIZARD15
Financial Expert Reviews Market Projections and Investment Strategies on Computer - Powered by Shutterstock - Get 15% off with code: PIKWIZARD15Stock market graph trading analysis investment financial, stock exchange financial or forex graph stock market graph chart business crisis crash loss and grow up gain and profits win up trend.  - Powered by Shutterstock - Get 15% off with code: PIKWIZARD15Stock market chart, exchange financial growth diagram.Analysis finance grow graph and market investment. Financial business plan,earnings,sale and strategy.  - Powered by Shutterstock - Get 15% off with code: PIKWIZARD15Stack of money coin and magnifying glass with graph and candle stick chart. Business and financial concept. Stock market analyzing, stock information search. - Powered by Shutterstock - Get 15% off with code: PIKWIZARD15Stock market or forex trading graph and candlestick chart suitable for financial investment concept. Economy trends background for business idea and all art work design. Abstract finance background.

 - Powered by Shutterstock - Get 15% off with code: PIKWIZARD15

Credit Photo

If you would like to credit the Photo, here are some ways you can do so

Free (free of charge)

Free for personal and commercial use.

Author: Awesome Content

Similar Free Stock Images

Dynamic Financial Data Display in Digital Space
Premium
Analysis finance grow graph and market  investment. Financial  business plan,earnings,sale and strategy. Stock market chart, exchange financial growth diagram.
Digital Financial Graph with Dynamic Trading Analysis
Futuristic Data Visualization with Financial Statistics
Financial Data Charts with World Map on Blue Digital Background
Fluctuating Financial Graph with Red Line on Green Grid
Premium
Magnifying glass and documents with analytics data lying on table,selective focus
Data Analytics and Financial Growth Indicators
Digital Data Analysis with Green Line Graph on Grid Background
Financial Data Line Graph on Digital Display
Dynamic Stock Market Data on Digital Interface
Premium
Businessman analyzes profitability of working companies with digital augmented reality graphics, positive indicators in 2024, businessman calculates financial data for long-term investments.
Economic Data Analysis Graph over Gabon Flag Background
Dynamic Stock Market Graphs Over Digital Interface
Holographic Financial Graph with Dynamic Line Chart
Falling Business Graph on Green Digital Background
Premium
Businesswomen pointing to arrow up virtual to forecast and analyze the stock market and economic year 2025 with virtual chart,  trend upside business market growth, investments and financial concept.
Abstract Data Visualization with Dynamic Charts and Graphs
Rising Financial Data Graph on Digital Grid Background
Dynamic Lines Show Rising Financial Statistics Over Time
Data Analysis Graphics on Digital Grid Background
Premium
Stock market or forex trading graph in graphic concept with copyspace suitable for financial investment or Economic trends business idea and all art work design. Abstract finance background
Dynamic Financial Graphs Overlaying Modern Cityscape
Cityscape with Digital Stock Market Graphs and Statistics
Real-Time Financial Data Analysis with Graphs and Charts
Abstract Financial Data Charts Reflecting Economic Trends
Premium
Stockmarket online trading chart candlestick on crypto currency platform. Stock exchange financial market price candles graph data pattern analysis concept. Computer screen closeup background
Dynamic Financial Data Displays Stock Market Trends
Fluctuating Stock Market Graph with Dramatic Peaks
Futuristic Analytics Graph with Cyan-Orange Line Trends
Futuristic Data Visualization with Dynamic Graphs and Digital Globe
Digital Financial Data with Arrows Indicating Growth
Digital Financial Data Overlaying City Skyline at Dusk
Premium
Double exposure image of coin stacks on technology financial graph background.Economy trends background for business ,financial meltdown ,Cryptocurrency digital economy.
Economic and Political Factors Influence Investment Trends
Financial Data Graph Rendering Global Market Trends
Dynamic Financial Graph Over Red Background
Dynamic Financial Graphs Illustrating Market Trends
Premium
Explore the stock market trends for 2024 with analytical visuals of businessman planning long term investments and future business growth, Navigate towards success with smart strategies.
Dynamic Financial Graph on Digital Background
Digital Financial Data with Graph and Grid Patterns
Financial Graph Analysis on Green Grid Background
Analyzing Data Trends on Digital Graph Interface
Premium
Financial accounting of profit summary graphs analysis. The business plan at the meeting and analyze financial numbers to view the performance of the company.
Data Analytics Graphs on Digital Interface Background
Dynamic Financial Data Visualizations on Grid Interface
Abstract Digital Financial Data Chart with Pink Line Oscillations
Digital Data Visualization with Trend Lines and Percentage Changes
Premium
Business strategy development and growing growth plan.	
Financial management strategy for business growth.Graph and chart. Investment of growth on currency rate.
Abstract Digital Charts with Social Media Metrics Rising
Dynamic Green Line Graph Depicting Financial Data
Financial Data Analysis Vibrant Graphs on Blue Background
Dynamic Stock Market Analysis Concept Artwork
Premium
Real estate, development and investing concept with financial chart indicators and stock market graphs on city skyscrapers tops bottom view, double exposure
Dynamic Red Line Graph With Data Points on Gridded Background
Dynamic Financial Data Overlaid on Grid Background
Digital Stock Market Data and Trends Visualization
Abstract Financial Data Processing and Analysis Interface
Premium
Stock market or forex trading graph and candlestick chart suitable for financial investment concept. Economy trends background for business idea and all art work design. Abstract finance background.
Digital Stock Market Graph Red Trendline on Green Background
Analyzing Stock Market Trends with Candlestick Chart and Data Visualization
Futuristic Multi-Series Data Visualization Dashboard Chart
Dynamic Financial Data Graph on Blue Digital Background
Financial Data Visualization with Cityscape Overlay
Graphical Analysis on Russian Economy with Financial Metrics
Premium
Man look at the dashboard with graphs and charts. Concept of data management system, business intelligence, data statistics, marketing analysis, key performance indicators (KPI) and analytics.
Financial Data Flow against Urban Skyline Backdrop
Dynamic Line Chart with Histogram on Digital Grid Background
Rising Digital Graph and Data Visualizations on Black Background
Digital Finance: Modern Stock Market Analysis Display
Premium
Stock market or forex trading graph on touchscreen,  finance and investment concept. Economy trends for business, financial charts and digits.
Abstract Financial Graph with Rising Waves on Red Gradient
Data Trends and Analysis on 3D Digital Grid
Dynamic Data Visualization and Financial Growth Curves
Dynamic Financial Growth Digital Chart Display
Premium
Stock market or forex trading graph in futuristic concept suitable for financial investment or Economic trends business idea and all art work design. Abstract finance background
Dynamic Financial Data Chart Display with Graphical Analysis
Digital Financial Data Processing with Graphs and Charts
Financial Data Analysis in Digital Interface with Graphs
Rising Graph Line on Digital Green Grid Background
Premium
Stock market graph trading analysis investment financial, stock exchange financial or forex graph stock market graph chart business crisis crash loss and grow up gain and profits win up trend
Data Visualization on Security Shield Interface for Cyber Security
Financial Data Analysis on Blue Digital Interface
Global Business Finance Data Analysis Visualization
Financial Data Analysis with Interactive Graphs
Premium
A businesswoman studies digital data to analyze positive business trends in 2025. This analysis reveals insights into business, marketing, and economic concepts.
Dynamic Financial Data on Dark Background With Colorful Graphs
Global Financial Data and Stock Market Trends on World Map
Abstract Data Visualization Digital Chart Background
Dynamic Stock Market Chart with Fluctuating Trends and Data Points
Premium
Stock market Investor analyst broker analyzing financial trade crypto stockmarket exchange platform digital chart data on computer screen thinking of investing analytic risk. Over shoulder view.
Financial Dashboard with Data Visualization and Social Interaction Metrics
Candlestick Chart Visualization with Indicators and Growth Highlight
Financial Data Overlay on Cityscape Visualizing Market Trends
Dynamic Financial Graphs Over Cityscape Background
Graph Showing Ukraine Economic Crisis Indicators
Economy and Finance Analytics on Benin Flag Background
Premium
A magnifying glass over a financial chart, illustrating market analysis and business concepts, in blue light against a dark background.
Falling Line Graph on Navy Background Illustrating Economic Decline
Financial Stock Market Data Analysis on Digital Interface
Fluctuating Digital Stock Market Data Chart
Futuristic Graph and Data Visualization Interface Design
Premium
hand show graph chart stock market economic. growth business concept. plan strategy company increase profit to success global. trend marketing grows technology digital. economy, financial, and invest
Abstract Digital Interface with Network Connections and Data Visualizations
Abstract Financial Data with Dynamic Graphs on Blue Background
European Market Data Overlay with EU Flag and Financial Graphs
Abstract Digital Finance Chart Showing Fluctuating Graph Lines
Premium
Analysis finance grow graph and market investment. Financial business plan,earnings,sale and strategy. Stock market chart, exchange financial growth diagram.
Dynamic Forex Trading Graphs with Increasing Numbers
Digital Analysis of Financial Data with Dynamic Graphs
Financial Graphs with Social Media Analytics on Digital Chart
City Skyline with Overlay of Financial Market Trends
Premium
Business people analyze financial data chart trading forex, investing in stock markets, funds and digital assets, Business finance technology and investment concept, Business finance background.
Digital Data and Financial Charts on White Background
Analyzing Financial Data on Digital World Map Background
Dynamic Financial Graphs Overlaying Urban Skyline
Green Line Graph with Data Points on Grid Background
Premium
graph stock market economics, chart growth business to success globally. concept of investment, plan strategy, increase profit, financial economy, and grow marketing. digital technology trend
Fluctuating Financial Graph on Green Grid Background
Abstract Digital Data Graph and Diagrams on Gray Background
Dynamic Financial Stock Market Analysis Display
Financial Chart with Dynamic Data on Black Grid
Premium
Man look at the dashboard with graphs and charts. Concept of data management system, business intelligence, data statistics, marketing analysis, key performance indicators (KPI) and analytics.
Financial Growth Chart with Data Visualization Elements