- Home >
- Stock Photos >
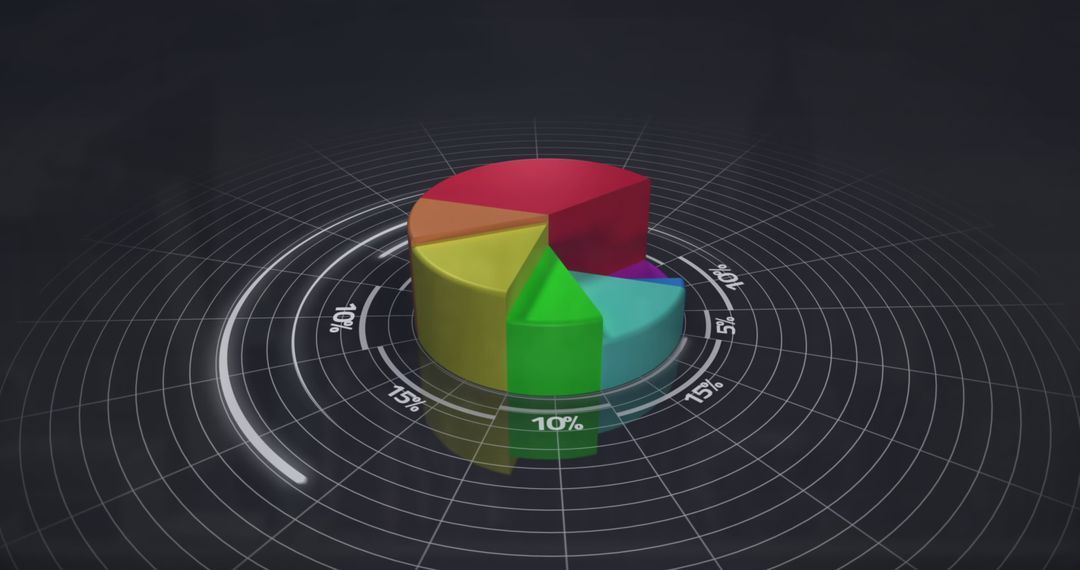
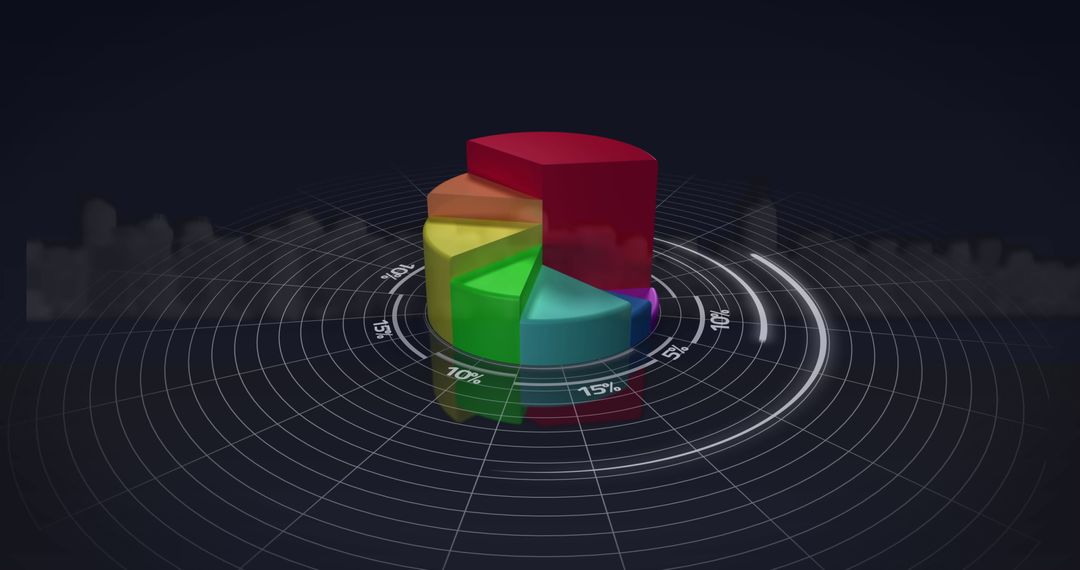
- Colorful Visualization of Financial Data Insights and Analytics
Colorful Visualization of Financial Data Insights and Analytics Image

Vibrant graphic showcasing various charts and graphs on white background, ideal for presentations, reports, and educational materials focused on business analytics and data interpretation. Useful in explaining complex financial stats with clarity for company meetings, financial planning, or academic purposes.
Powered by 


2
downloads
downloads
Tags:
More
Credit Photo
If you would like to credit the Photo, here are some ways you can do so
Text Link
photo Link
<span class="text-link">
<span>
<a target="_blank" href=https://pikwizard.com/photo/colorful-visualization-of-financial-data-insights-and-analytics/dfd8aa6a28ad43647ac37fe1cb72849f/>PikWizard</a>
</span>
</span>
<span class="image-link">
<span
style="margin: 0 0 20px 0; display: inline-block; vertical-align: middle; width: 100%;"
>
<a
target="_blank"
href="https://pikwizard.com/photo/colorful-visualization-of-financial-data-insights-and-analytics/dfd8aa6a28ad43647ac37fe1cb72849f/"
style="text-decoration: none; font-size: 10px; margin: 0;"
>
<img src="https://pikwizard.com/pw/medium/dfd8aa6a28ad43647ac37fe1cb72849f.jpg" style="margin: 0; width: 100%;" alt="" />
<p style="font-size: 12px; margin: 0;">PikWizard</p>
</a>
</span>
</span>
Free (free of charge)
Free for personal and commercial use.
Author: Creative Art
Similar Free Stock Images

Premium


Premium


Premium


Premium


Premium


Premium


Premium