
- Home >
- Stock Photos >
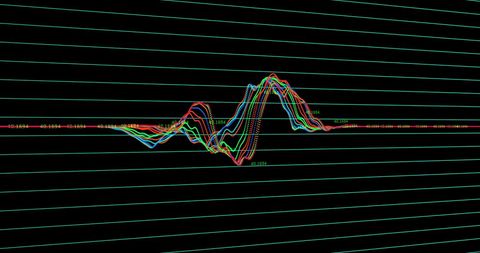
- Colorful Waveform Pattern on Analytical Digital Interface
Colorful Waveform Pattern on Analytical Digital Interface Image

This visually striking representation of multicolored waveform curves incorporates numeric annotations and green grid lines to enhance the analytical aspect. Suitable for illustrating topics on technology, data analysis, digital interfaces, or educational purposes detailing science-related contexts. Can be used in online articles, presentations, and tutorial material focusing on data and its interpretations.
Powered by 


downloads
Tags:
More
Credit Photo
If you would like to credit the Photo, here are some ways you can do so
Text Link
photo Link
<span class="text-link">
<span>
<a target="_blank" href=https://pikwizard.com/photo/colorful-waveform-pattern-on-analytical-digital-interface/dcf57ced74697c8776e50e51608bd555/>PikWizard</a>
</span>
</span>
<span class="image-link">
<span
style="margin: 0 0 20px 0; display: inline-block; vertical-align: middle; width: 100%;"
>
<a
target="_blank"
href="https://pikwizard.com/photo/colorful-waveform-pattern-on-analytical-digital-interface/dcf57ced74697c8776e50e51608bd555/"
style="text-decoration: none; font-size: 10px; margin: 0;"
>
<img src="https://pikwizard.com/pw/medium/dcf57ced74697c8776e50e51608bd555.jpg" style="margin: 0; width: 100%;" alt="" />
<p style="font-size: 12px; margin: 0;">PikWizard</p>
</a>
</span>
</span>
Free (free of charge)
Free for personal and commercial use.
Author: People Creations
Similar Free Stock Images

Premium


Premium


Premium

Premium

Premium


Premium


Premium

Premium

Premium

Premium


Premium

Premium


Premium

Premium


Premium


Premium


Premium


Premium


Premium


Premium


Premium

Premium


AI

Premium


Premium


Premium


Explore More Free Stock Images