
- Home >
- Stock Photos >
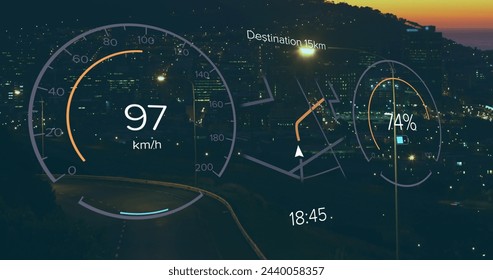
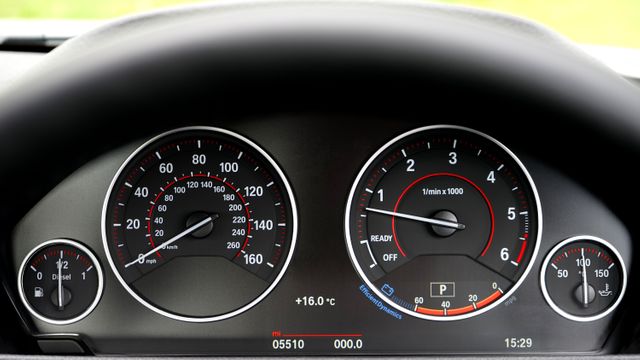
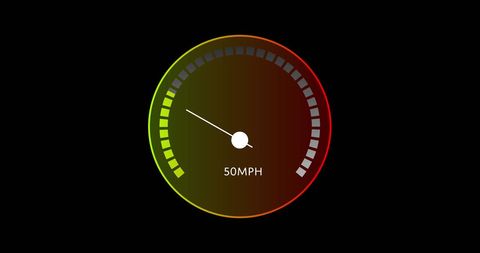
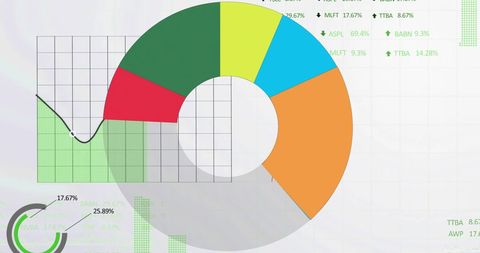
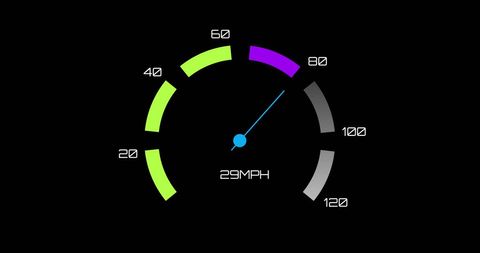
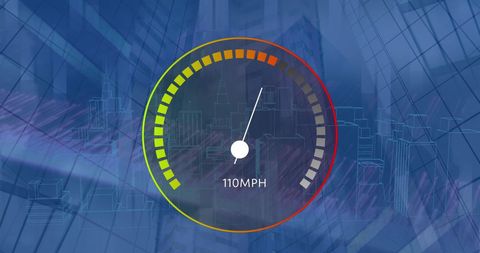
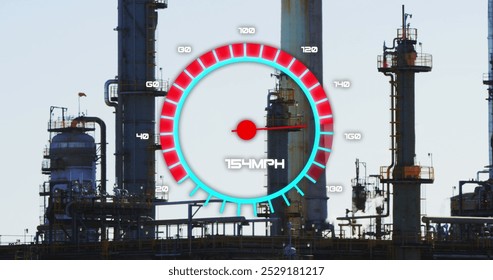
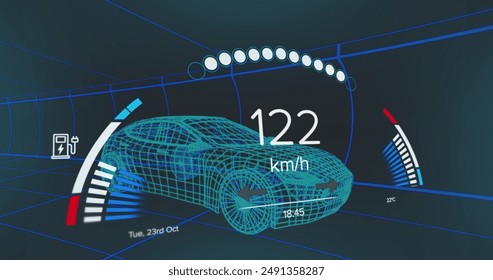
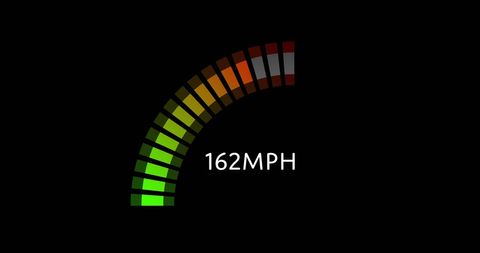
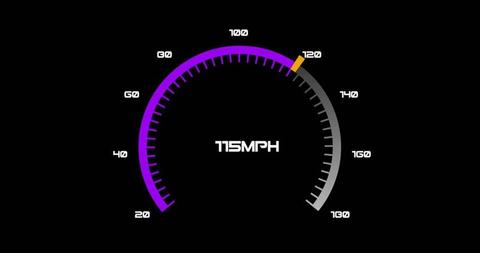
- Combining Data Analytics with Speed Dashboard for Efficiency
Combining Data Analytics with Speed Dashboard for Efficiency Image

Data and technology graphic featuring a speedometer combined with digital code to symbolize the integration of data processing and technological efficiency. Suitable for use in illustrations related to finance, business analytics, digital transformation, and speculative futures in data management. Could enhance content focused on innovation, technological growth, and global finance systems.
Powered by  - Get 15% off with code: PIKWIZARD15


downloads
Tags:
More
Credit Photo
If you would like to credit the Photo, here are some ways you can do so
Text Link
photo Link
<span class="text-link">
<span>
<a target="_blank" href=https://pikwizard.com/photo/combining-data-analytics-with-speed-dashboard-for-efficiency/1fa4365830d8cecd33d2e95afe6dd77b/>PikWizard</a>
</span>
</span>
<span class="image-link">
<span
style="margin: 0 0 20px 0; display: inline-block; vertical-align: middle; width: 100%;"
>
<a
target="_blank"
href="https://pikwizard.com/photo/combining-data-analytics-with-speed-dashboard-for-efficiency/1fa4365830d8cecd33d2e95afe6dd77b/"
style="text-decoration: none; font-size: 10px; margin: 0;"
>
<img src="https://pikwizard.com/pw/medium/1fa4365830d8cecd33d2e95afe6dd77b.jpg" style="margin: 0; width: 100%;" alt="" />
<p style="font-size: 12px; margin: 0;">PikWizard</p>
</a>
</span>
</span>
Free (free of charge)
Free for personal and commercial use.
Author: Creative Art
Similar Free Stock Images

Premium


Premium


Premium

Premium


Premium

Premium


Premium


Premium


Premium

Premium


Premium

Premium

Premium

Premium


Premium
Premium


Premium


Premium

Premium


Premium

Premium


Premium


Premium


Premium


Premium

Explore More Free Stock Images