- Home >
- Stock Photos >
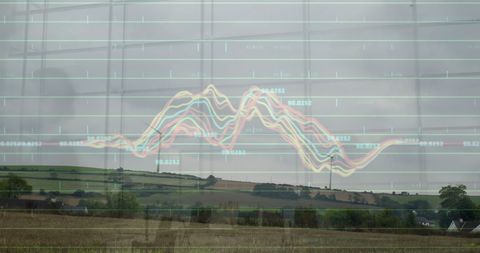
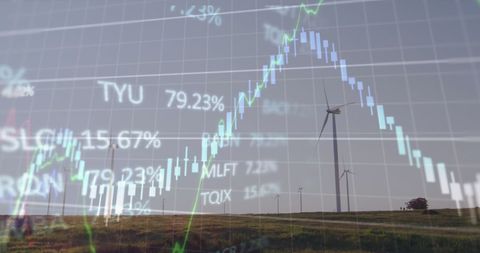
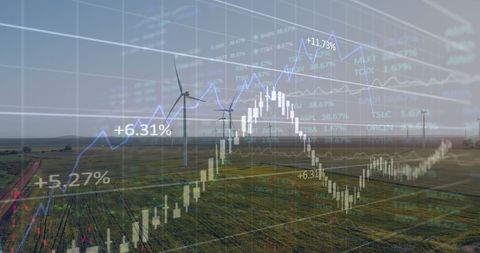
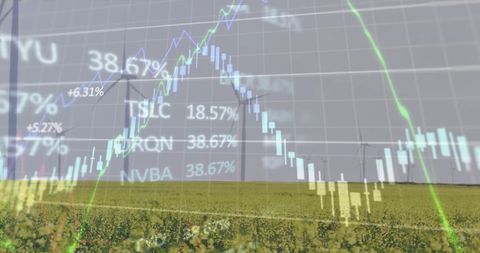
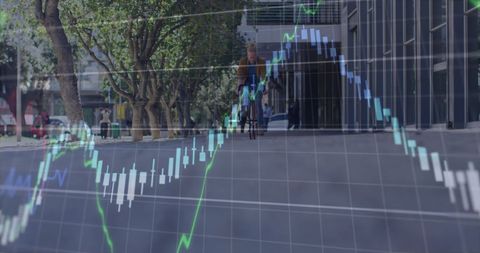
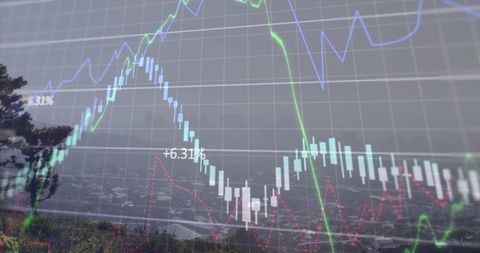
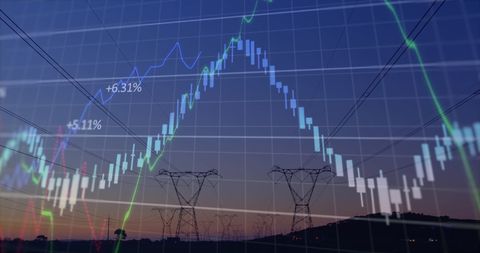
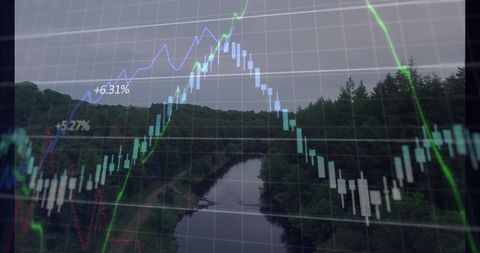
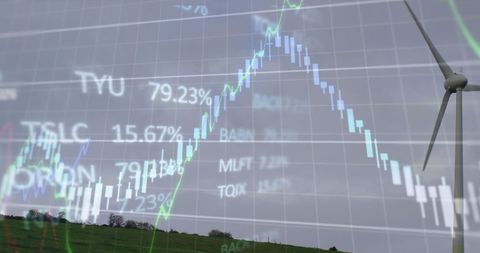
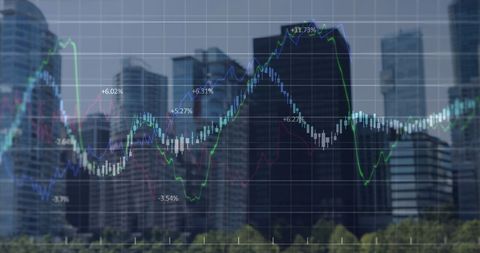
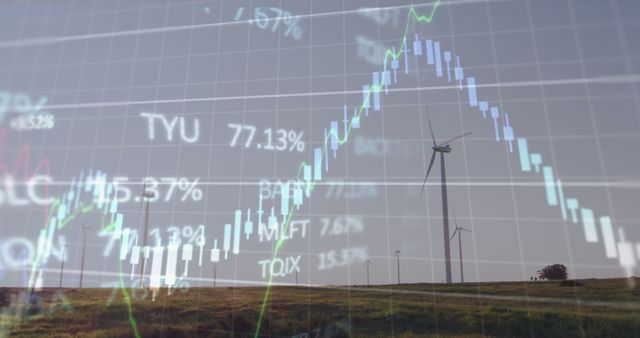
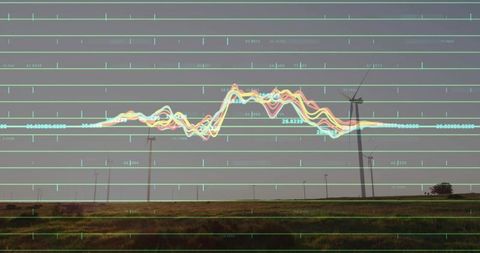
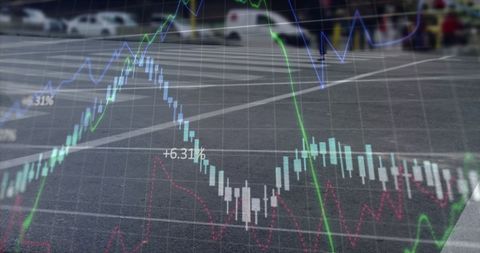
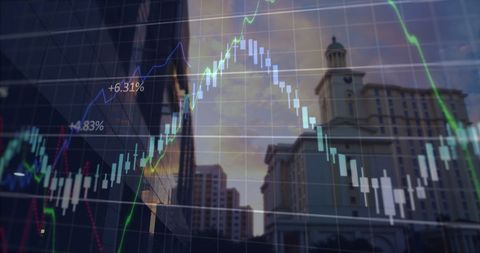
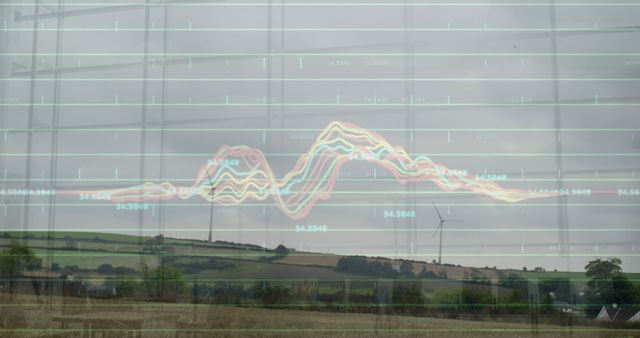
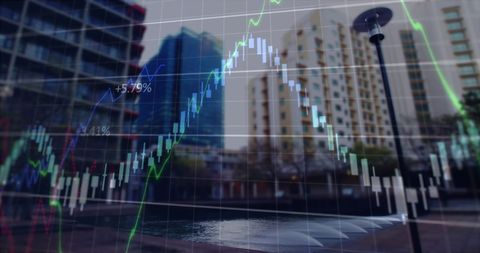
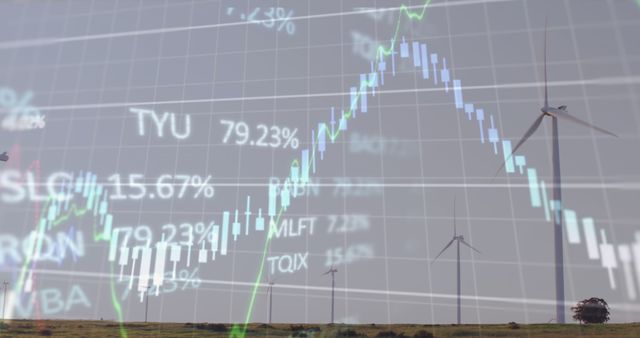
- Combining Renewable Energy with Dynamic Financial Data Visualization
Combining Renewable Energy with Dynamic Financial Data Visualization Image
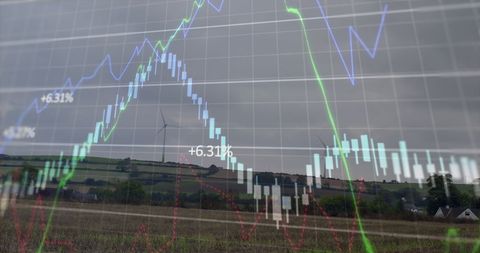
Dynamic composition highlighting the integration of renewable energy with global financial trends makes it ideal for illustrating convergence of eco-friendly investments and data analysis. Useful for articles or presentations on sustainability in economics and technological innovation.

downloads
Tags:
More
Credit Photo
If you would like to credit the Photo, here are some ways you can do so
Text Link
photo Link
<span class="text-link">
<span>
<a target="_blank" href=https://pikwizard.com/photo/combining-renewable-energy-with-dynamic-financial-data-visualization/9c16cbc057bea81ec4cad7819fac2275/>PikWizard</a>
</span>
</span>
<span class="image-link">
<span
style="margin: 0 0 20px 0; display: inline-block; vertical-align: middle; width: 100%;"
>
<a
target="_blank"
href="https://pikwizard.com/photo/combining-renewable-energy-with-dynamic-financial-data-visualization/9c16cbc057bea81ec4cad7819fac2275/"
style="text-decoration: none; font-size: 10px; margin: 0;"
>
<img src="https://pikwizard.com/pw/medium/9c16cbc057bea81ec4cad7819fac2275.jpg" style="margin: 0; width: 100%;" alt="" />
<p style="font-size: 12px; margin: 0;">PikWizard</p>
</a>
</span>
</span>
Free (free of charge)
Free for personal and commercial use.
Author: Awesome Content