
- Home >
- Stock Photos >
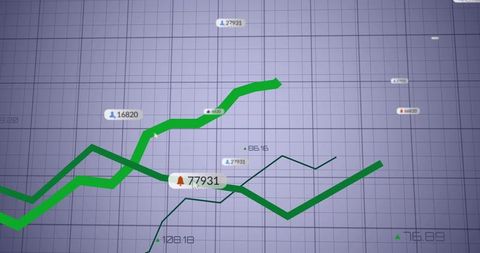
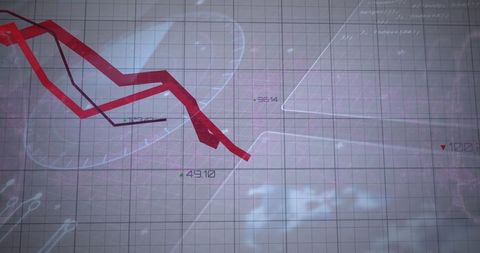
- Complex Data Analysis with Interactive Charts and Arrows
Complex Data Analysis with Interactive Charts and Arrows Image

This visually engaging composition of graphs and charts communicates complexity in data analysis and futuristic business intelligence insights. Utilized on finance or technology websites, presentations, or company reports, it encapsulates global trends and market insights in a simplified visual way, indicating growth or potential monitoring perturbations.
Powered by 


downloads
Tags:
More
Credit Photo
If you would like to credit the Photo, here are some ways you can do so
Text Link
photo Link
<span class="text-link">
<span>
<a target="_blank" href=https://pikwizard.com/photo/complex-data-analysis-with-interactive-charts-and-arrows/47c32d0c262850f9cbaa46c64679316b/>PikWizard</a>
</span>
</span>
<span class="image-link">
<span
style="margin: 0 0 20px 0; display: inline-block; vertical-align: middle; width: 100%;"
>
<a
target="_blank"
href="https://pikwizard.com/photo/complex-data-analysis-with-interactive-charts-and-arrows/47c32d0c262850f9cbaa46c64679316b/"
style="text-decoration: none; font-size: 10px; margin: 0;"
>
<img src="https://pikwizard.com/pw/medium/47c32d0c262850f9cbaa46c64679316b.jpg" style="margin: 0; width: 100%;" alt="" />
<p style="font-size: 12px; margin: 0;">PikWizard</p>
</a>
</span>
</span>
Free (free of charge)
Free for personal and commercial use.
Author: People Creations
Similar Free Stock Images

Premium


Premium


Premium


Premium


Premium


Premium


Premium

Premium

Premium

Premium


Premium


Premium


Premium


Premium


Premium


Premium

Premium


Premium


Premium

Premium


Premium


Premium


Premium

Premium

Premium


Explore More Free Stock Images