
- Home >
- Stock Photos >
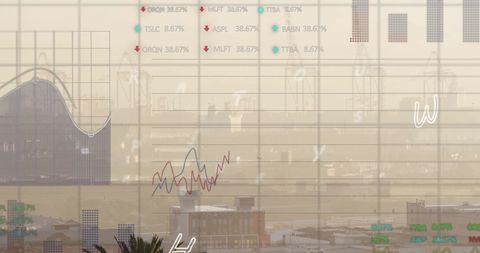
- Complex Data Charts Overlaying Urban Cityscape Landscape
Complex Data Charts Overlaying Urban Cityscape Landscape Image

Data charts intersect busy city landscapes, perfect for visualizing articles and presentations on finance, economy insights, urban dynamics, tech evolution, business strategies, or global market transitions.
Powered by  - Get 15% off with code: PIKWIZARD15


downloads
Tags:
More
Credit Photo
If you would like to credit the Photo, here are some ways you can do so
Text Link
photo Link
<span class="text-link">
<span>
<a target="_blank" href=https://pikwizard.com/photo/complex-data-charts-overlaying-urban-cityscape-landscape/aa6973f42cdd67cca53fa9d89d3f073c/>PikWizard</a>
</span>
</span>
<span class="image-link">
<span
style="margin: 0 0 20px 0; display: inline-block; vertical-align: middle; width: 100%;"
>
<a
target="_blank"
href="https://pikwizard.com/photo/complex-data-charts-overlaying-urban-cityscape-landscape/aa6973f42cdd67cca53fa9d89d3f073c/"
style="text-decoration: none; font-size: 10px; margin: 0;"
>
<img src="https://pikwizard.com/pw/medium/aa6973f42cdd67cca53fa9d89d3f073c.jpg" style="margin: 0; width: 100%;" alt="" />
<p style="font-size: 12px; margin: 0;">PikWizard</p>
</a>
</span>
</span>
Free (free of charge)
Free for personal and commercial use.
Author: Awesome Content
Similar Free Stock Images

Premium


Premium

Premium

Premium
Premium


Premium

Premium

Premium


Premium


Premium


Premium


Premium


Premium


Premium

Premium

Premium


Premium

Premium

Premium


Premium

Premium


Premium

Premium

Premium


Premium


Explore More Free Stock Images