
- Home >
- Stock Photos >
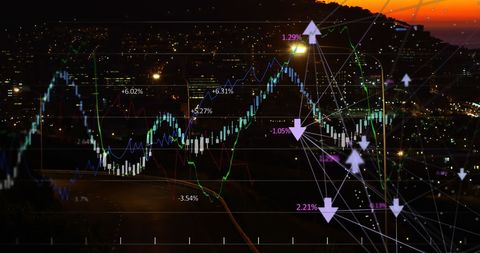
- Complex Digital Financial Data on Grid
Complex Digital Financial Data on Grid Image

This depiction of layered data points and lines against a grid symbolizes modern finance and data processing trends, emphasizing complex interactions within the business environment. Suitable for illustrating articles on modern statistics, financial technology advancements, or global economic discussions. Ideal for both educational content and business presentations focusing on technology in the financial sector.
Powered by  - Get 15% off with code: PIKWIZARD15


downloads
Tags:
More
Credit Photo
If you would like to credit the Photo, here are some ways you can do so
Text Link
photo Link
<span class="text-link">
<span>
<a target="_blank" href=https://pikwizard.com/photo/complex-digital-financial-data-on-grid/a89eb9e279829e4ee9b787a6e1d398f5/>PikWizard</a>
</span>
</span>
<span class="image-link">
<span
style="margin: 0 0 20px 0; display: inline-block; vertical-align: middle; width: 100%;"
>
<a
target="_blank"
href="https://pikwizard.com/photo/complex-digital-financial-data-on-grid/a89eb9e279829e4ee9b787a6e1d398f5/"
style="text-decoration: none; font-size: 10px; margin: 0;"
>
<img src="https://pikwizard.com/pw/medium/a89eb9e279829e4ee9b787a6e1d398f5.jpg" style="margin: 0; width: 100%;" alt="" />
<p style="font-size: 12px; margin: 0;">PikWizard</p>
</a>
</span>
</span>
Free (free of charge)
Free for personal and commercial use.
Author: Authentic Images
Similar Free Stock Images

Premium


Premium

Premium


Premium


Premium


Premium


Premium


Premium


Premium

Premium

Premium


Premium


Premium


Premium


Premium


Premium


Premium


Premium


Premium


Premium


Premium

Premium


Premium


Premium


Premium


Explore More Free Stock Images