
- Home >
- Stock Photos >
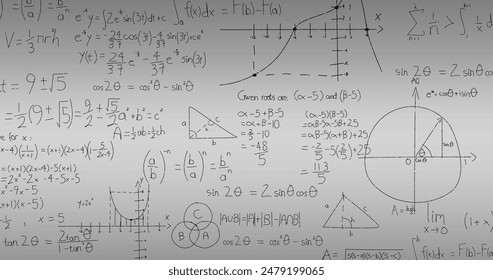
- Complex Equations and Graphs in Digital Space for Scientific Research
Complex Equations and Graphs in Digital Space for Scientific Research Image

Abstract representation of a futuristic data environment combining floating equations and digital graphs. Ideal for illustrating complex concepts in educational materials, scientific research presentations, and innovative technology in data analysis. Useful for visual aids in online courses and research papers on advanced mathematics or statistics.
Powered by  - Get 15% off with code: PIKWIZARD15


2
downloads
downloads
Tags:
More
Credit Photo
If you would like to credit the Photo, here are some ways you can do so
Text Link
photo Link
<span class="text-link">
<span>
<a target="_blank" href=https://pikwizard.com/photo/complex-equations-and-graphs-in-digital-space-for-scientific-research/586f4d53250b1c18b91ab4da9604ecaa/>PikWizard</a>
</span>
</span>
<span class="image-link">
<span
style="margin: 0 0 20px 0; display: inline-block; vertical-align: middle; width: 100%;"
>
<a
target="_blank"
href="https://pikwizard.com/photo/complex-equations-and-graphs-in-digital-space-for-scientific-research/586f4d53250b1c18b91ab4da9604ecaa/"
style="text-decoration: none; font-size: 10px; margin: 0;"
>
<img src="https://pikwizard.com/pw/medium/586f4d53250b1c18b91ab4da9604ecaa.jpg" style="margin: 0; width: 100%;" alt="" />
<p style="font-size: 12px; margin: 0;">PikWizard</p>
</a>
</span>
</span>
Free (free of charge)
Free for personal and commercial use.
Author: Authentic Images
Similar Free Stock Images

Premium


Premium


Premium


Premium


Premium


Premium


Premium


Premium


Premium


Premium


Premium


Premium


Premium


Premium


Premium


Premium


Premium


Premium


Premium


Premium


Premium


Premium


Premium


Premium

