
- Home >
- Stock Photos >
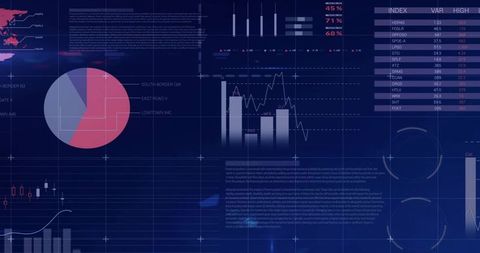
- Complex Financial Analytics and Data Visualization in Digital Space
Complex Financial Analytics and Data Visualization in Digital Space Image

Digital visualization presents financial data with overlays of various statistics and charts. Ideal for illustrating concepts of global business trends, advanced financial computing, and data-driven decision-making in corporate settings. Suitable for presentations focused on enhancing data processing capabilities in finance or projecting how technology impacts global economic strategies.
Powered by 


downloads
Tags:
More
Credit Photo
If you would like to credit the Photo, here are some ways you can do so
Text Link
photo Link
<span class="text-link">
<span>
<a target="_blank" href=https://pikwizard.com/photo/complex-financial-analytics-and-data-visualization-in-digital-space/c916a006c92356a957923e4fcda3371d/>PikWizard</a>
</span>
</span>
<span class="image-link">
<span
style="margin: 0 0 20px 0; display: inline-block; vertical-align: middle; width: 100%;"
>
<a
target="_blank"
href="https://pikwizard.com/photo/complex-financial-analytics-and-data-visualization-in-digital-space/c916a006c92356a957923e4fcda3371d/"
style="text-decoration: none; font-size: 10px; margin: 0;"
>
<img src="https://pikwizard.com/pw/medium/c916a006c92356a957923e4fcda3371d.jpg" style="margin: 0; width: 100%;" alt="" />
<p style="font-size: 12px; margin: 0;">PikWizard</p>
</a>
</span>
</span>
Free (free of charge)
Free for personal and commercial use.
Author: Awesome Content
Similar Free Stock Images

Premium


Premium

Premium


Premium


Premium


Premium


Premium


Premium


Premium

Premium

Premium

Premium


Premium

Premium

Premium


Premium


Premium


Premium


Premium


Premium

Premium


Premium

Premium


Premium


Premium

Explore More Free Stock Images