
- Home >
- Stock Photos >
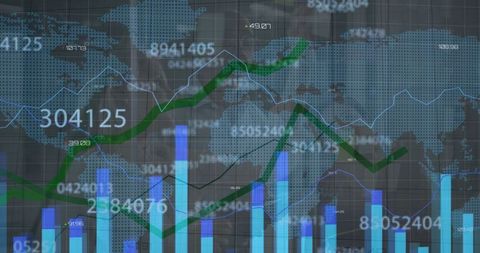
- Complex Financial Dashboard with Graphs and Data Analytics Display
Complex Financial Dashboard with Graphs and Data Analytics Display Image

Depicts a high-tech financial dashboard merging various graphs and analytics. Ideal for illustrating articles on finance technology, data-driven investment strategies, or global economy predictions. Suitable for websites dealing with financial data analysis or technology companies promoting analytical tools.
Powered by  - Get 15% off with code: PIKWIZARD15


downloads
Tags:
More
Credit Photo
If you would like to credit the Photo, here are some ways you can do so
Text Link
photo Link
<span class="text-link">
<span>
<a target="_blank" href=https://pikwizard.com/photo/complex-financial-dashboard-with-graphs-and-data-analytics-display/33254141a51a29c83b6fe3766706e37c/>PikWizard</a>
</span>
</span>
<span class="image-link">
<span
style="margin: 0 0 20px 0; display: inline-block; vertical-align: middle; width: 100%;"
>
<a
target="_blank"
href="https://pikwizard.com/photo/complex-financial-dashboard-with-graphs-and-data-analytics-display/33254141a51a29c83b6fe3766706e37c/"
style="text-decoration: none; font-size: 10px; margin: 0;"
>
<img src="https://pikwizard.com/pw/medium/33254141a51a29c83b6fe3766706e37c.jpg" style="margin: 0; width: 100%;" alt="" />
<p style="font-size: 12px; margin: 0;">PikWizard</p>
</a>
</span>
</span>
Free (free of charge)
Free for personal and commercial use.
Author: Authentic Images
Similar Free Stock Images

Premium


Premium


Premium


Premium


Premium


Premium


Premium


Premium

Premium


Premium


Premium


Premium


Premium

Premium

Premium


Premium


Premium


Premium


Premium


Premium

Premium

Premium


Premium


Premium

Premium


Explore More Free Stock Images