- Home >
- Stock Photos >
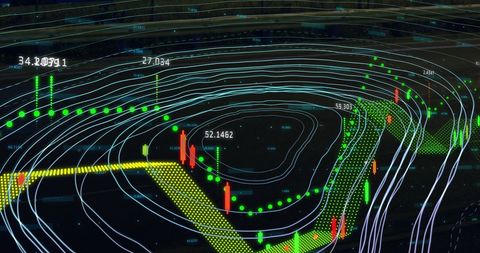
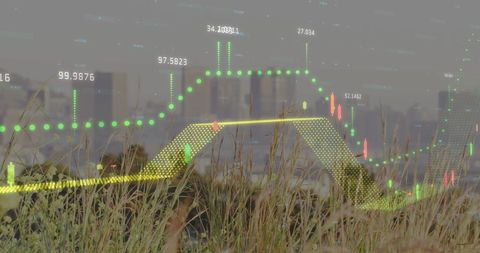
- Complex Financial Data Analytics Over Urban Skyline Background
Complex Financial Data Analytics Over Urban Skyline Background Image

This digitally rendered depiction of financial data processing with an urban skyline background can be used to illustrate global finance themes or technology-enabled data insights. Ideal for websites or presentations about financial analytics, business strategy discussions, technological advancements in finance or urban economic developments.

downloads
Tags:
More
Credit Photo
If you would like to credit the Photo, here are some ways you can do so
Text Link
photo Link
<span class="text-link">
<span>
<a target="_blank" href=https://pikwizard.com/photo/complex-financial-data-analytics-over-urban-skyline-background/f075bb76b12708ab16c294653e5207de/>PikWizard</a>
</span>
</span>
<span class="image-link">
<span
style="margin: 0 0 20px 0; display: inline-block; vertical-align: middle; width: 100%;"
>
<a
target="_blank"
href="https://pikwizard.com/photo/complex-financial-data-analytics-over-urban-skyline-background/f075bb76b12708ab16c294653e5207de/"
style="text-decoration: none; font-size: 10px; margin: 0;"
>
<img src="https://pikwizard.com/pw/medium/f075bb76b12708ab16c294653e5207de.jpg" style="margin: 0; width: 100%;" alt="" />
<p style="font-size: 12px; margin: 0;">PikWizard</p>
</a>
</span>
</span>
Free (free of charge)
Free for personal and commercial use.
Author: Creative Art