
- Home >
- Stock Photos >
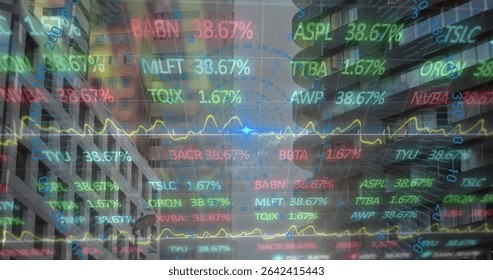
- Complex Financial Data Graph with Multicolored Trends and Analytics
Complex Financial Data Graph with Multicolored Trends and Analytics Image

Presents a busy visual of multiple colored trend lines and blue bars representing financial data on a digital trading interface. Useful for illustrating financial analytics, trading data insights, investment patterns, economic reports, stock market analysis, fintech aesthetics, or educational content focusing on modern data interpretation.
Powered by  - Get 15% off with code: PIKWIZARD15


downloads
Tags:
More
Credit Photo
If you would like to credit the Photo, here are some ways you can do so
Text Link
photo Link
<span class="text-link">
<span>
<a target="_blank" href=https://pikwizard.com/photo/complex-financial-data-graph-with-multicolored-trends-and-analytics/b85e33d265c4e14c33ef98f057622235/>PikWizard</a>
</span>
</span>
<span class="image-link">
<span
style="margin: 0 0 20px 0; display: inline-block; vertical-align: middle; width: 100%;"
>
<a
target="_blank"
href="https://pikwizard.com/photo/complex-financial-data-graph-with-multicolored-trends-and-analytics/b85e33d265c4e14c33ef98f057622235/"
style="text-decoration: none; font-size: 10px; margin: 0;"
>
<img src="https://pikwizard.com/pw/medium/b85e33d265c4e14c33ef98f057622235.jpg" style="margin: 0; width: 100%;" alt="" />
<p style="font-size: 12px; margin: 0;">PikWizard</p>
</a>
</span>
</span>
Free (free of charge)
Free for personal and commercial use.
Author: Awesome Content
Similar Free Stock Images

Premium


Premium

Premium


Premium


Premium

Premium

Premium


Premium


Premium


Premium


Premium


Premium

Premium

Premium

Premium

Premium


Premium


Premium


Premium

Premium


Premium


Premium

Premium


Premium


Premium


Explore More Free Stock Images