
- Home >
- Stock Photos >
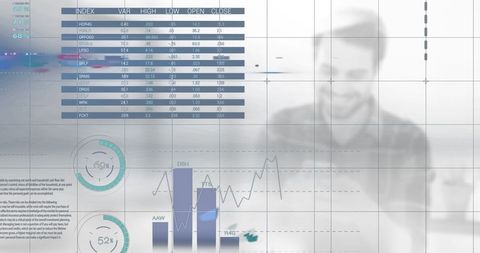
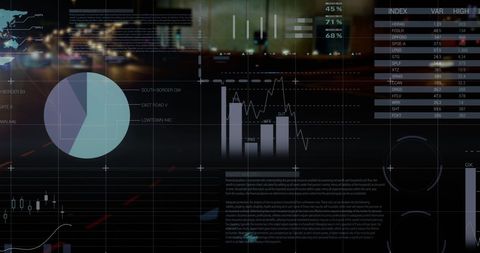
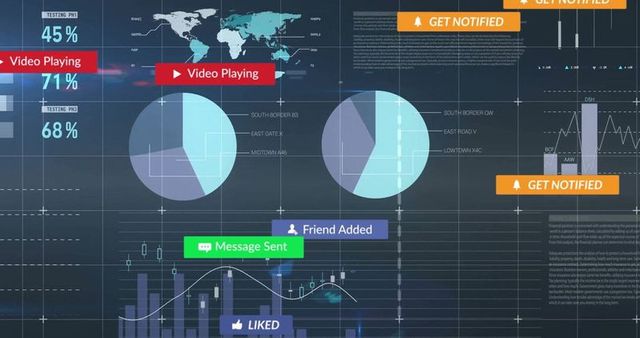
- Complex Financial Data Visualization with Analytics Overlay
Complex Financial Data Visualization with Analytics Overlay Image

Visual showcasing intricate financial data analysts can use to interpret market trends. Featuring charts and graphs juxtaposed over a blurred background. Ideal for presentations, financial reports, technology-themed designs. Perfect for conveying complex statistical concepts in a clear manner for business intelligence professionals or for illustrating modern financial software applications.
Powered by 


downloads
Tags:
More
Credit Photo
If you would like to credit the Photo, here are some ways you can do so
Text Link
photo Link
<span class="text-link">
<span>
<a target="_blank" href=https://pikwizard.com/photo/complex-financial-data-visualization-with-analytics-overlay/7baeeeefec102ae8763a9f0038a8e992/>PikWizard</a>
</span>
</span>
<span class="image-link">
<span
style="margin: 0 0 20px 0; display: inline-block; vertical-align: middle; width: 100%;"
>
<a
target="_blank"
href="https://pikwizard.com/photo/complex-financial-data-visualization-with-analytics-overlay/7baeeeefec102ae8763a9f0038a8e992/"
style="text-decoration: none; font-size: 10px; margin: 0;"
>
<img src="https://pikwizard.com/pw/medium/7baeeeefec102ae8763a9f0038a8e992.jpg" style="margin: 0; width: 100%;" alt="" />
<p style="font-size: 12px; margin: 0;">PikWizard</p>
</a>
</span>
</span>
Free (free of charge)
Free for personal and commercial use.
Author: Awesome Content
Similar Free Stock Images

Premium


Premium


Premium


Premium


Premium


Premium

Premium

Premium

Premium


Premium


Premium


Premium


Premium


Premium

Premium


Premium

Premium

Premium


Premium


Premium


Premium

Premium


Premium


Premium


Premium


Explore More Free Stock Images