
- Home >
- Stock Photos >
- Complex Financial Data Visualization with Diverse Graphs
Complex Financial Data Visualization with Diverse Graphs Image
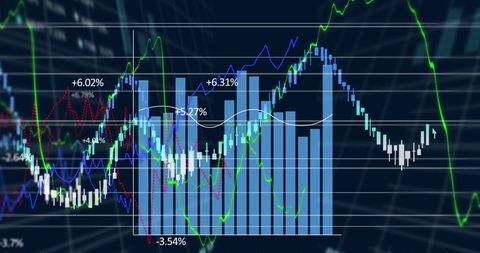
This image illustrates a complex array of financial data making a blend of bar graphs, line graphs, and numeric data on a dark blue background. It is ideal for use in sectors dealing with finance, stock market analysis, or economics. Could be used in presentations, financial reports, investment strategies documentation or tutorials on financial analysis techniques.

downloads
Tags:
More
Credit Photo
If you would like to credit the Photo, here are some ways you can do so
Text Link
photo Link
<span class="text-link">
<span>
<a target="_blank" href=https://pikwizard.com/photo/complex-financial-data-visualization-with-diverse-graphs/54f5308138a53c8a2c7692f21ddd20e1/>PikWizard</a>
</span>
</span>
<span class="image-link">
<span
style="margin: 0 0 20px 0; display: inline-block; vertical-align: middle; width: 100%;"
>
<a
target="_blank"
href="https://pikwizard.com/photo/complex-financial-data-visualization-with-diverse-graphs/54f5308138a53c8a2c7692f21ddd20e1/"
style="text-decoration: none; font-size: 10px; margin: 0;"
>
<img src="https://pikwizard.com/pw/medium/54f5308138a53c8a2c7692f21ddd20e1.jpg" style="margin: 0; width: 100%;" alt="" />
<p style="font-size: 12px; margin: 0;">PikWizard</p>
</a>
</span>
</span>
Free (free of charge)
Free for personal and commercial use.
Author: Awesome Content