- Home >
- Stock Photos >
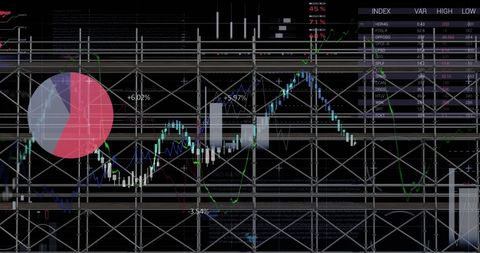
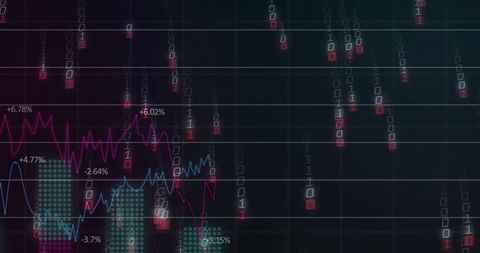
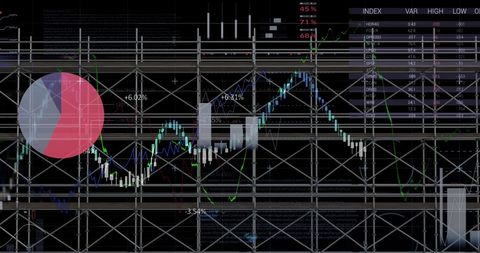
- Complex Financial Data Visualization with Graphs and Charts
Complex Financial Data Visualization with Graphs and Charts Image

Digitized presentation of various financial data elements including graphs, charts, and overlays, all set against a dark backdrop. This concept represents modern financial analysis and data processing in a global business context. Useful for illustrating fintech solutions, advanced analytics, and automated trading platforms.

downloads
Tags:
More
Credit Photo
If you would like to credit the Photo, here are some ways you can do so
Text Link
photo Link
<span class="text-link">
<span>
<a target="_blank" href=https://pikwizard.com/photo/complex-financial-data-visualization-with-graphs-and-charts/82a4ec791957e4ec2b406496e748e096/>PikWizard</a>
</span>
</span>
<span class="image-link">
<span
style="margin: 0 0 20px 0; display: inline-block; vertical-align: middle; width: 100%;"
>
<a
target="_blank"
href="https://pikwizard.com/photo/complex-financial-data-visualization-with-graphs-and-charts/82a4ec791957e4ec2b406496e748e096/"
style="text-decoration: none; font-size: 10px; margin: 0;"
>
<img src="https://pikwizard.com/pw/medium/82a4ec791957e4ec2b406496e748e096.jpg" style="margin: 0; width: 100%;" alt="" />
<p style="font-size: 12px; margin: 0;">PikWizard</p>
</a>
</span>
</span>
Free (free of charge)
Free for personal and commercial use.
Author: Awesome Content