
- Home >
- Stock Photos >
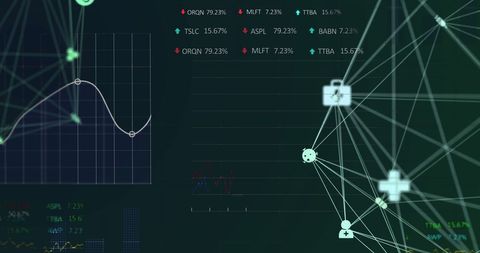
- Complex Financial Data Visualizations Over Dark Background
Complex Financial Data Visualizations Over Dark Background Image

This image shows various complex financial data visualizations over a dark background, illustrating global finance concepts. It can be used for corporate presentations, financial reports, technology-focused articles, and educational purposes, serving as a visual metaphor for data processing and business analysis in the modern financial world.
Powered by 


downloads
Tags:
More
Credit Photo
If you would like to credit the Photo, here are some ways you can do so
Text Link
photo Link
<span class="text-link">
<span>
<a target="_blank" href=https://pikwizard.com/photo/complex-financial-data-visualizations-over-dark-background/ba5869153a801e043ce28b0f91539d49/>PikWizard</a>
</span>
</span>
<span class="image-link">
<span
style="margin: 0 0 20px 0; display: inline-block; vertical-align: middle; width: 100%;"
>
<a
target="_blank"
href="https://pikwizard.com/photo/complex-financial-data-visualizations-over-dark-background/ba5869153a801e043ce28b0f91539d49/"
style="text-decoration: none; font-size: 10px; margin: 0;"
>
<img src="https://pikwizard.com/pw/medium/ba5869153a801e043ce28b0f91539d49.jpg" style="margin: 0; width: 100%;" alt="" />
<p style="font-size: 12px; margin: 0;">PikWizard</p>
</a>
</span>
</span>
Free (free of charge)
Free for personal and commercial use.
Author: Creative Art
Similar Free Stock Images

Premium


Premium

Premium


Premium


Premium


Premium


Premium


Premium


Premium


Premium


Premium


Premium


Premium


Premium


Premium

Premium


Premium

Premium


Premium


Premium


Premium


Premium


Premium


Premium


Premium


Explore More Free Stock Images