- Home >
- Stock Photos >
- Complex Financial Data Visuals with Coding Elements and Charts
Complex Financial Data Visuals with Coding Elements and Charts Image

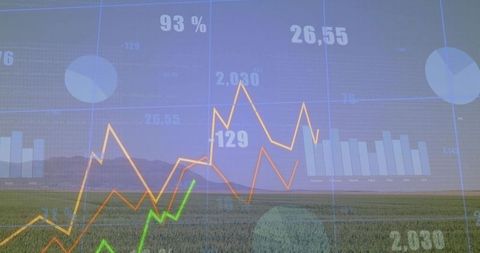
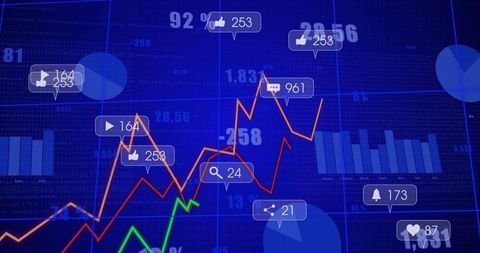
Visualizing complex financial data with superimposed coding creates a dynamic intersection of technology and finance. Fluctuating lines and bar charts reflect real-time market analysis, making this perfect for representing investment strategies or financial trends. Useful for finance, software development presentations, or advertising financial tech solutions.

downloads
Tags:
More
Credit Photo
If you would like to credit the Photo, here are some ways you can do so
Text Link
photo Link
<span class="text-link">
<span>
<a target="_blank" href=https://pikwizard.com/photo/complex-financial-data-visuals-with-coding-elements-and-charts/427d901d5544586bdc35683c71e20983/>PikWizard</a>
</span>
</span>
<span class="image-link">
<span
style="margin: 0 0 20px 0; display: inline-block; vertical-align: middle; width: 100%;"
>
<a
target="_blank"
href="https://pikwizard.com/photo/complex-financial-data-visuals-with-coding-elements-and-charts/427d901d5544586bdc35683c71e20983/"
style="text-decoration: none; font-size: 10px; margin: 0;"
>
<img src="https://pikwizard.com/pw/medium/427d901d5544586bdc35683c71e20983.jpg" style="margin: 0; width: 100%;" alt="" />
<p style="font-size: 12px; margin: 0;">PikWizard</p>
</a>
</span>
</span>
Free (free of charge)
Free for personal and commercial use.
Author: Authentic Images