
- Home >
- Stock Photos >
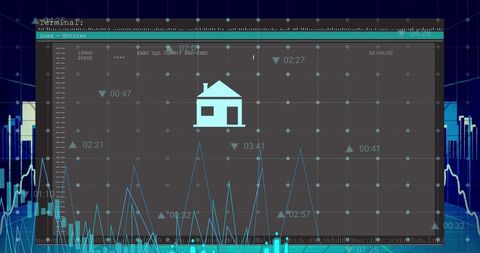
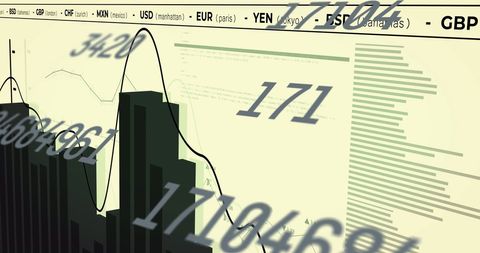
- Complex Financial Graphs with Global Currency Indicators
Complex Financial Graphs with Global Currency Indicators Image
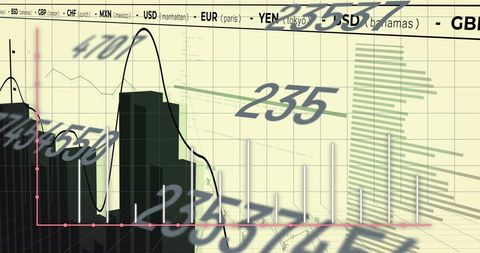
The illustration showcases interconnected financial graphs, charts, and numerical figures symbolizing various global currency indicators. It exudes a high-tech, data-rich environment reflecting international finance and economic monitoring. Ideal for business presentations, publications on market analysis, or educational content about global economic trends, conveying insights into the complex world of financial markets.
Powered by  - Get 15% off with code: PIKWIZARD15


downloads
Tags:
More
Credit Photo
If you would like to credit the Photo, here are some ways you can do so
Text Link
photo Link
<span class="text-link">
<span>
<a target="_blank" href=https://pikwizard.com/photo/complex-financial-graphs-with-global-currency-indicators/d11f5295ef519a5e7fd0737e47f08b93/>PikWizard</a>
</span>
</span>
<span class="image-link">
<span
style="margin: 0 0 20px 0; display: inline-block; vertical-align: middle; width: 100%;"
>
<a
target="_blank"
href="https://pikwizard.com/photo/complex-financial-graphs-with-global-currency-indicators/d11f5295ef519a5e7fd0737e47f08b93/"
style="text-decoration: none; font-size: 10px; margin: 0;"
>
<img src="https://pikwizard.com/pw/medium/d11f5295ef519a5e7fd0737e47f08b93.jpg" style="margin: 0; width: 100%;" alt="" />
<p style="font-size: 12px; margin: 0;">PikWizard</p>
</a>
</span>
</span>
Free (free of charge)
Free for personal and commercial use.
Author: People Creations
Similar Free Stock Images

Premium


Premium

Premium


Premium

Premium


Premium

Premium

Premium


Premium
Premium


Premium

Premium

Premium


Premium


Premium

Premium

Premium


Premium


Premium


Premium


Premium

Premium


Premium


Premium


Premium


Explore More Free Stock Images