
- Home >
- Stock Photos >
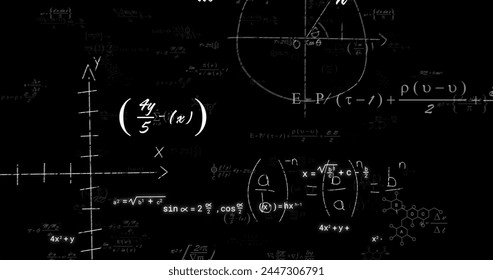
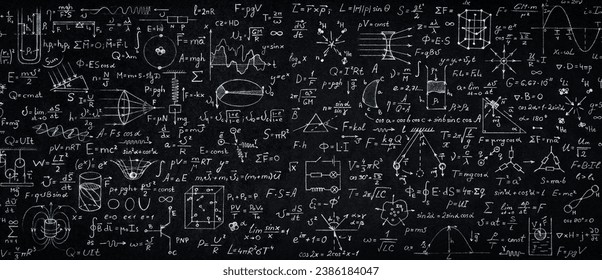
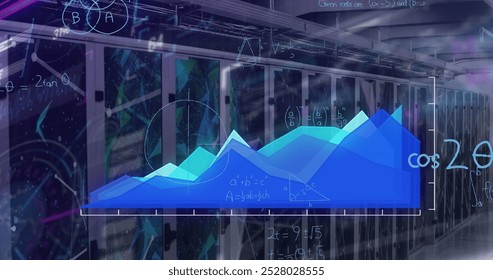
- Complex Mathematical Formulas and Graphs Over Dark Background
Complex Mathematical Formulas and Graphs Over Dark Background Image

This illustration displays complex mathematical formulas and geometric graphs set against a dark background. The digital ambience suggests technological and educational themes, making it suitable for use in academic presentations, educational platforms, science blogs, and materials emphasizing technology or artificial intelligence developments.
Powered by  - Get 15% off with code: PIKWIZARD15


downloads
Tags:
More
Credit Photo
If you would like to credit the Photo, here are some ways you can do so
Text Link
photo Link
<span class="text-link">
<span>
<a target="_blank" href=https://pikwizard.com/photo/complex-mathematical-formulas-and-graphs-over-dark-background/93b7738d55fde77ac81fdc3ad91ab3d4/>PikWizard</a>
</span>
</span>
<span class="image-link">
<span
style="margin: 0 0 20px 0; display: inline-block; vertical-align: middle; width: 100%;"
>
<a
target="_blank"
href="https://pikwizard.com/photo/complex-mathematical-formulas-and-graphs-over-dark-background/93b7738d55fde77ac81fdc3ad91ab3d4/"
style="text-decoration: none; font-size: 10px; margin: 0;"
>
<img src="https://pikwizard.com/pw/medium/93b7738d55fde77ac81fdc3ad91ab3d4.jpg" style="margin: 0; width: 100%;" alt="" />
<p style="font-size: 12px; margin: 0;">PikWizard</p>
</a>
</span>
</span>
Free (free of charge)
Free for personal and commercial use.
Author: Authentic Images
Similar Free Stock Images

Premium


Premium
Premium


Premium


Premium


Premium


Premium


Premium

Premium

Premium


Premium

Premium
Premium

Premium


Premium


Premium


Premium


Premium


Premium

Premium


Premium


Premium

Premium


Premium


Premium

Explore More Free Stock Images