- Home >
- Stock Photos >
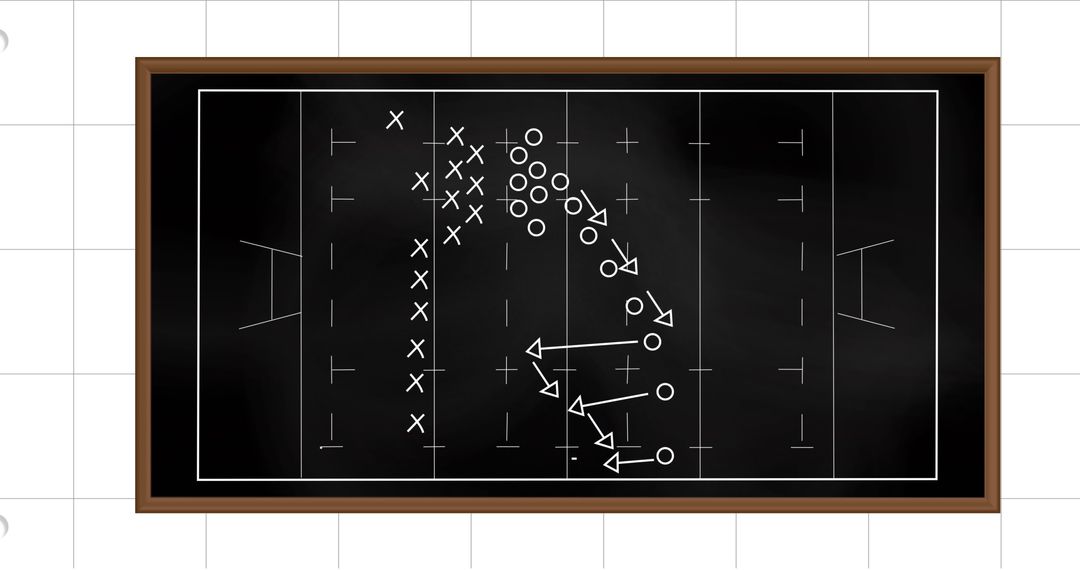
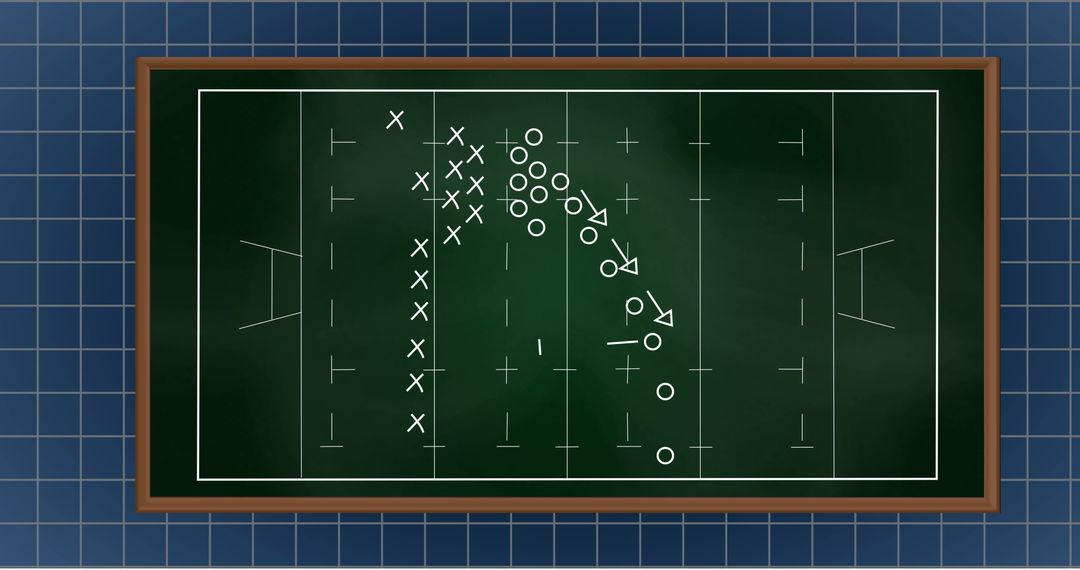
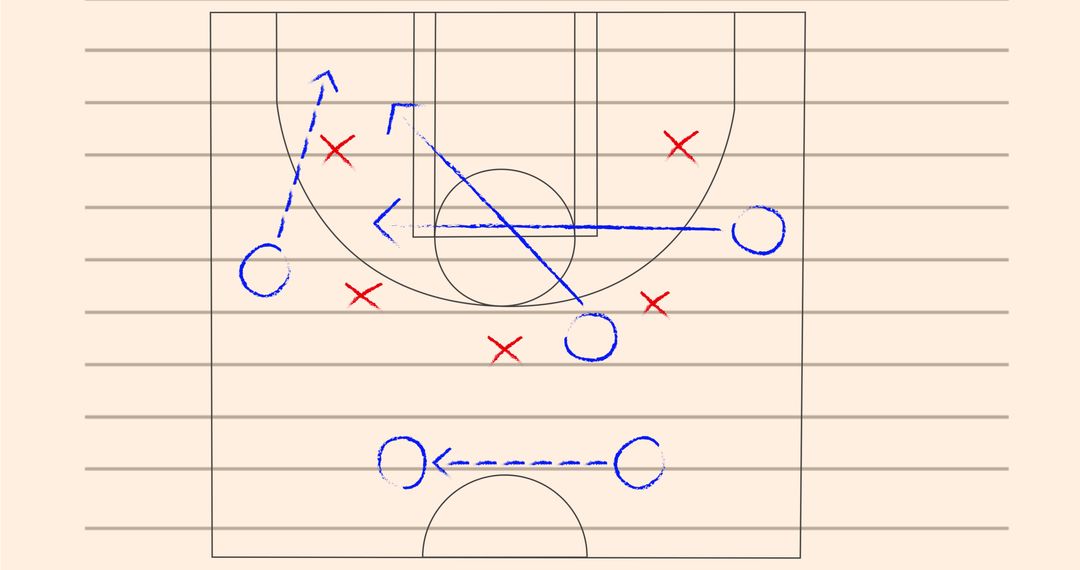
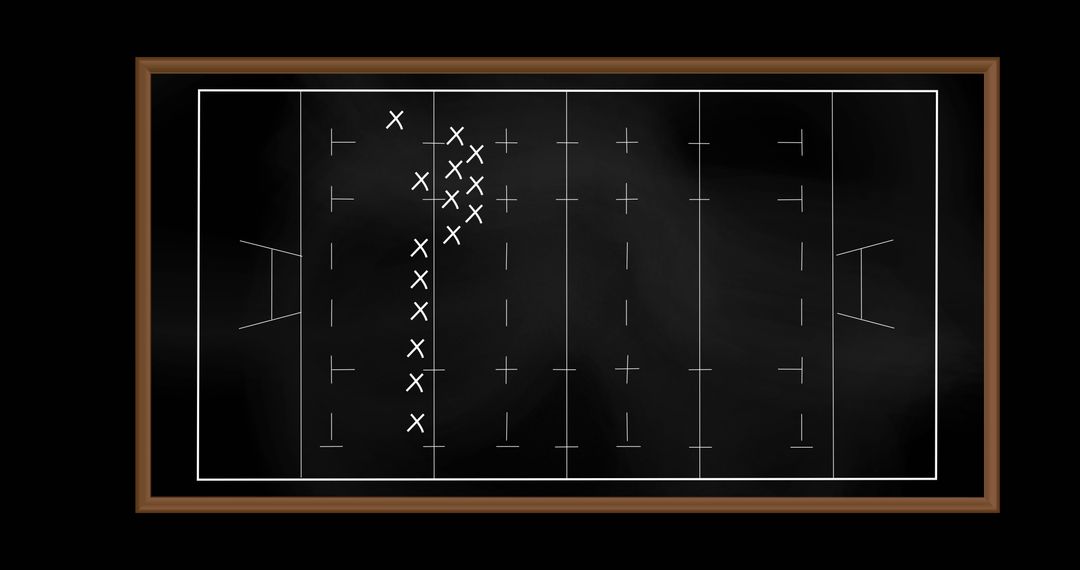
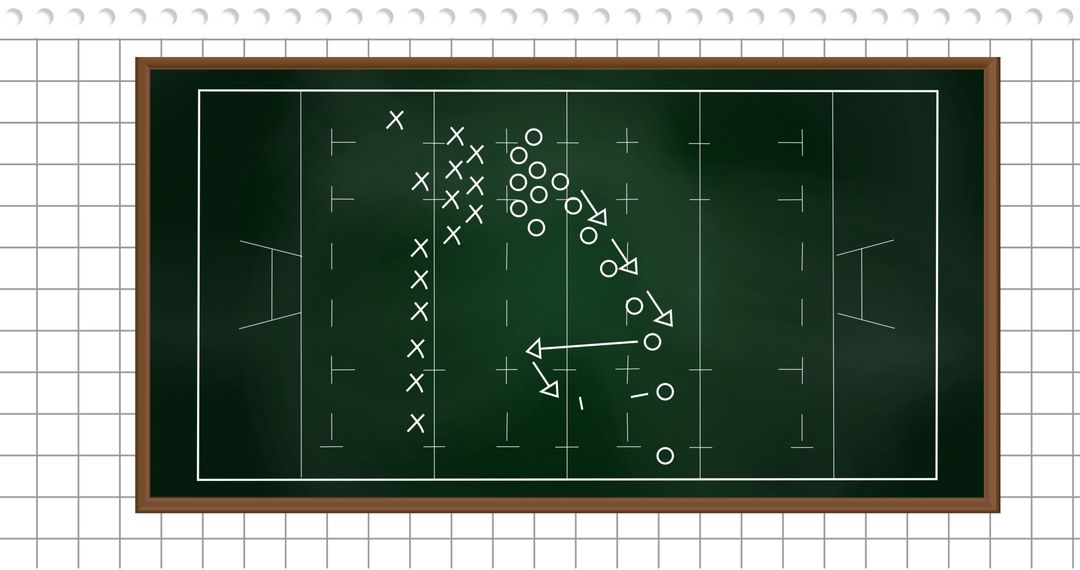
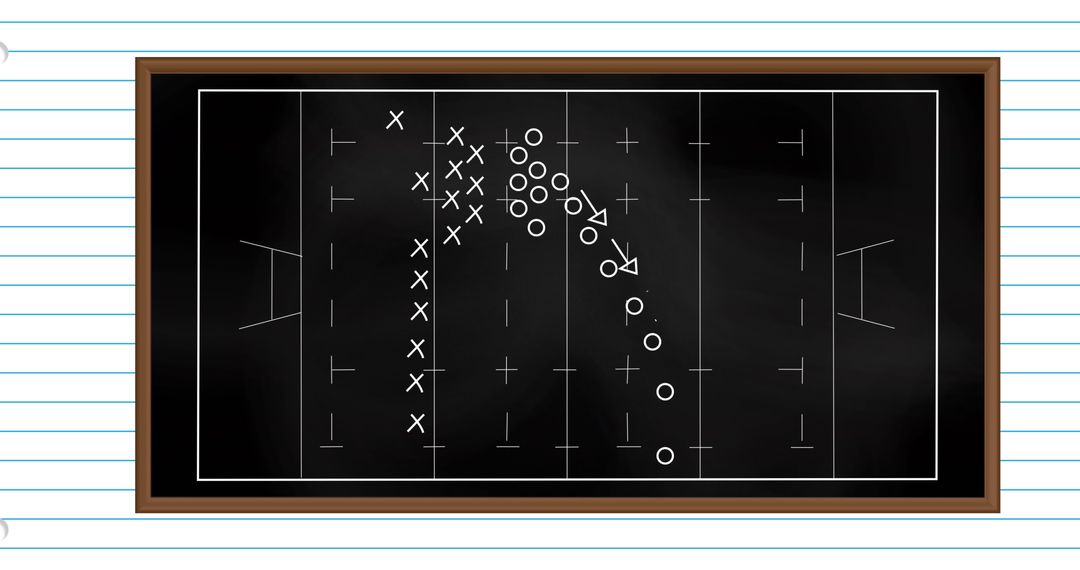
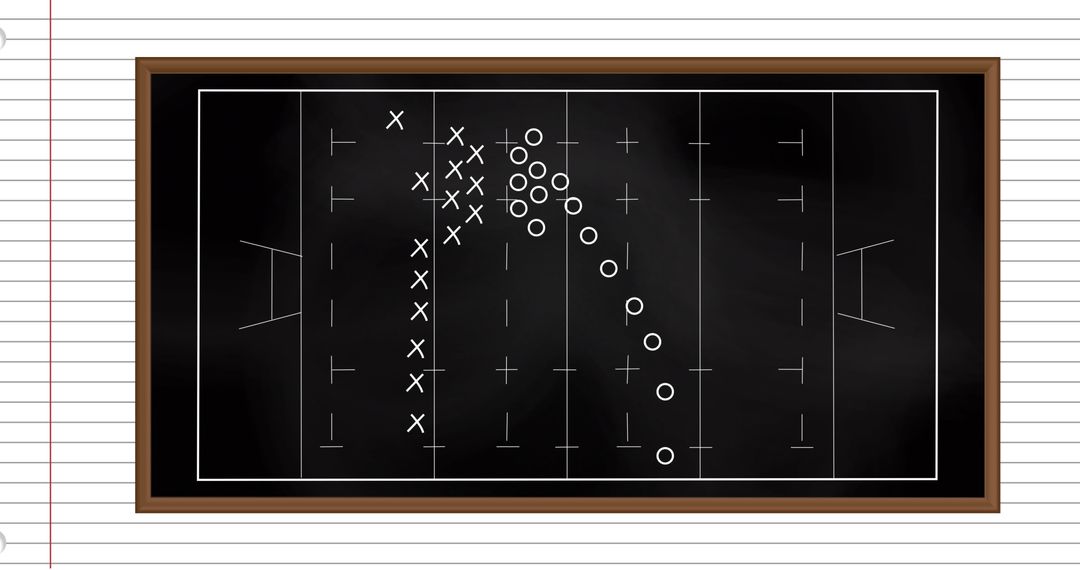
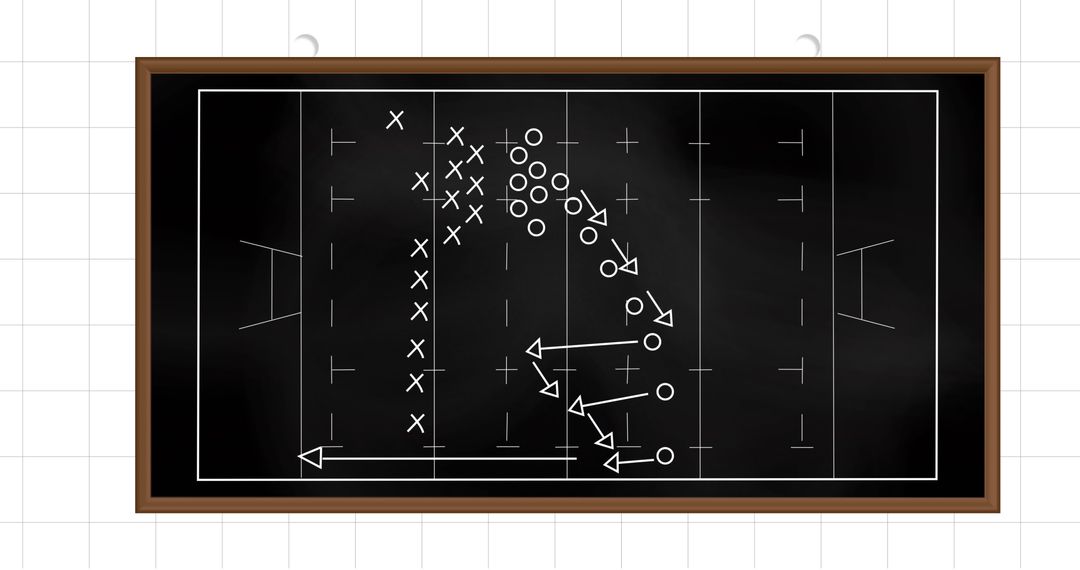
- Complex Sports Strategy Planning Display with Digital Interface
Complex Sports Strategy Planning Display with Digital Interface Image

This visually engaging display embodies sports strategies and planning using a digital interface set against a grid-like blueprint background. Useful for presentations on sports tactics, innovation in sports technology, and interactive design implementations. Ideal for showcasing the fusion of sports and digital tools in presentations and publications.
Powered by  - Get 15% off with code: PIKWIZARD15


2
downloads
downloads
Tags:
More
Credit Photo
If you would like to credit the Photo, here are some ways you can do so
Text Link
photo Link
<span class="text-link">
<span>
<a target="_blank" href=https://pikwizard.com/photo/complex-sports-strategy-planning-display-with-digital-interface/2902b94c2636be6735e800b413c374a3/>PikWizard</a>
</span>
</span>
<span class="image-link">
<span
style="margin: 0 0 20px 0; display: inline-block; vertical-align: middle; width: 100%;"
>
<a
target="_blank"
href="https://pikwizard.com/photo/complex-sports-strategy-planning-display-with-digital-interface/2902b94c2636be6735e800b413c374a3/"
style="text-decoration: none; font-size: 10px; margin: 0;"
>
<img src="https://pikwizard.com/pw/medium/2902b94c2636be6735e800b413c374a3.jpg" style="margin: 0; width: 100%;" alt="" />
<p style="font-size: 12px; margin: 0;">PikWizard</p>
</a>
</span>
</span>
Free (free of charge)
Free for personal and commercial use.
Author: Creative Art
Similar Free Stock Images

Premium


Premium


Premium


Premium


Premium


Premium


Premium


Premium


Premium


Premium


Premium


Premium


Premium


Premium


Premium


Premium


Premium


Premium


Premium


Premium


Premium


Premium


Premium


Premium