
- Home >
- Stock Photos >
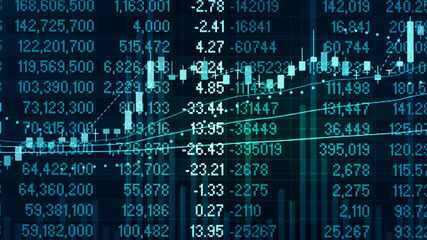
- Complex Stock Market Graph with Overlaid HTML Code Representation
Complex Stock Market Graph with Overlaid HTML Code Representation Image

Combining a stock market graph with HTML code, this image visually represents technology's influence in financial trading today. Ideal for use in blogs or articles about technology's role in finance, stocks, or algorithmic trading, it suits purposes including investment analysis, financial reports, and educational materials on economic trends and programming in finance.
Powered by 


downloads
Tags:
More
Credit Photo
If you would like to credit the Photo, here are some ways you can do so
Text Link
photo Link
<span class="text-link">
<span>
<a target="_blank" href=https://pikwizard.com/photo/complex-stock-market-graph-with-overlaid-html-code-representation/ffdd6d151cbc155d7695795f9179a3ce/>PikWizard</a>
</span>
</span>
<span class="image-link">
<span
style="margin: 0 0 20px 0; display: inline-block; vertical-align: middle; width: 100%;"
>
<a
target="_blank"
href="https://pikwizard.com/photo/complex-stock-market-graph-with-overlaid-html-code-representation/ffdd6d151cbc155d7695795f9179a3ce/"
style="text-decoration: none; font-size: 10px; margin: 0;"
>
<img src="https://pikwizard.com/pw/medium/ffdd6d151cbc155d7695795f9179a3ce.jpg" style="margin: 0; width: 100%;" alt="" />
<p style="font-size: 12px; margin: 0;">PikWizard</p>
</a>
</span>
</span>
Free (free of charge)
Free for personal and commercial use.
Author: Awesome Content
Similar Free Stock Images

Premium


Premium

Premium


Premium

Premium


Premium


Premium


Premium

Premium


Premium

Premium

Premium

Premium


Premium


Premium

Premium

Premium


Premium


Premium


Premium


Premium

Premium


Premium


Premium


Premium

Explore More Free Stock Images