- Home >
- Stock Photos >
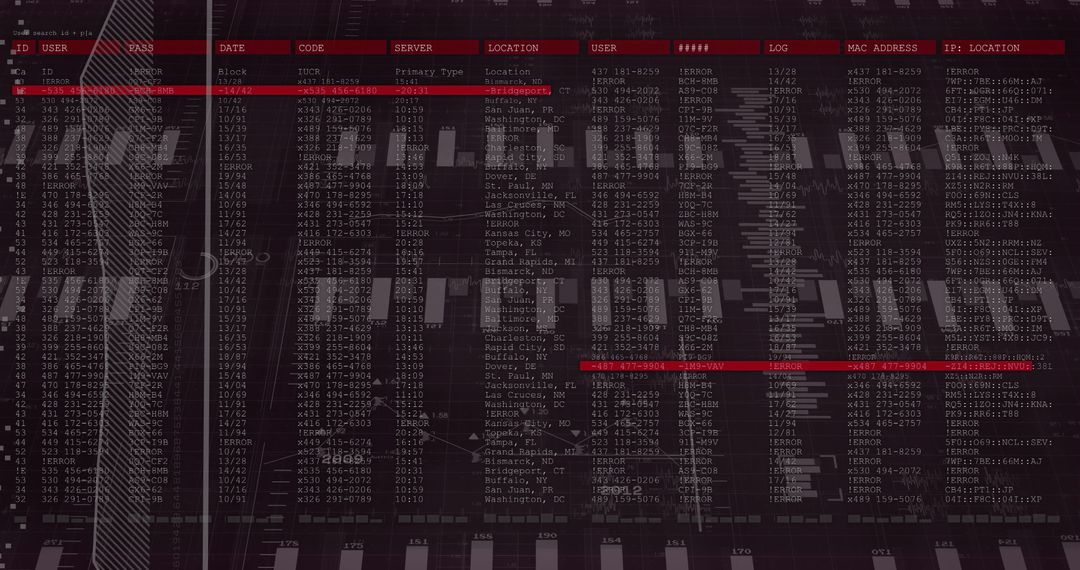
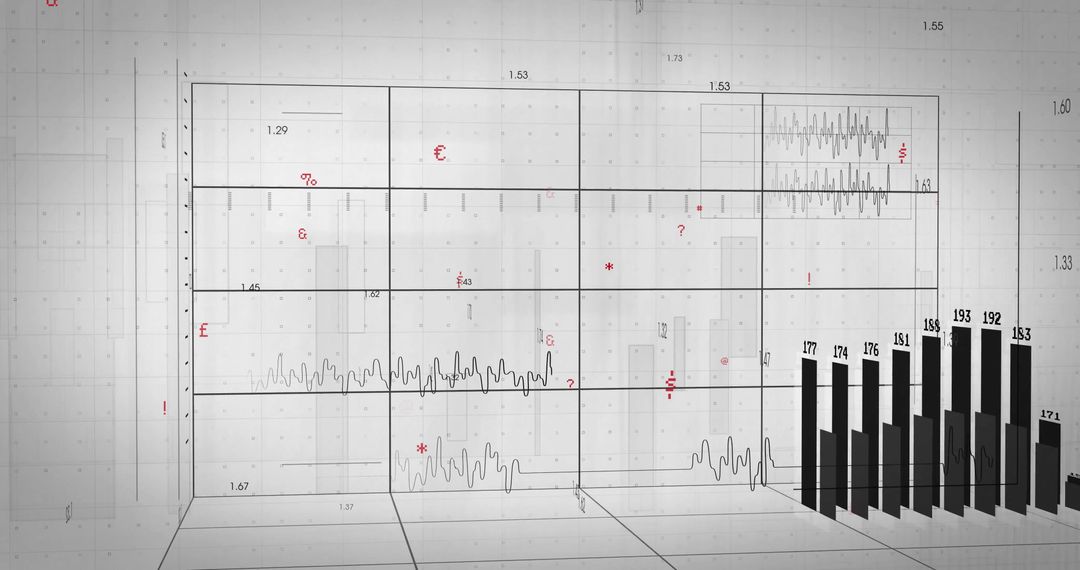
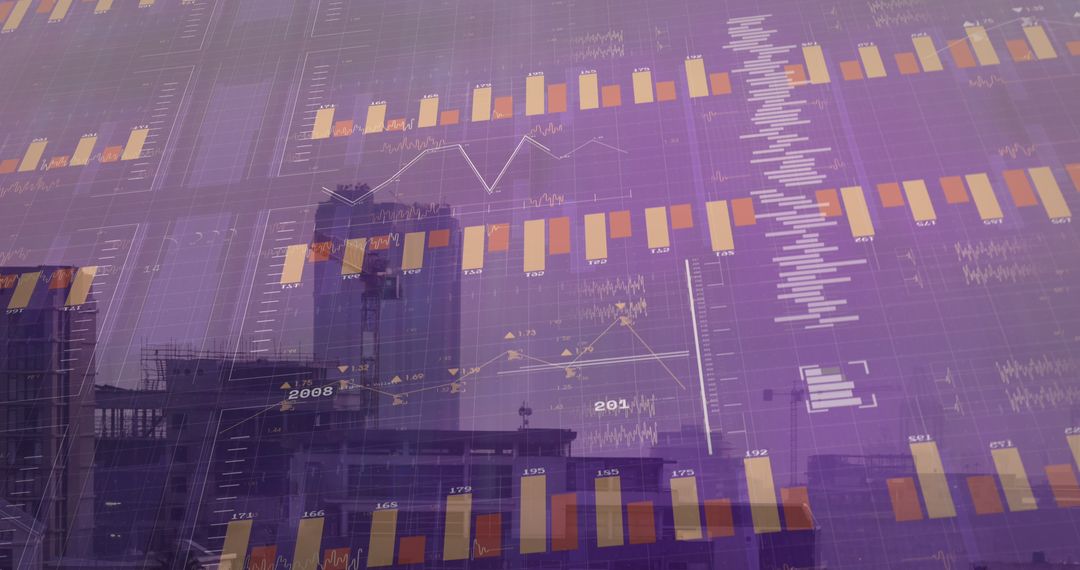
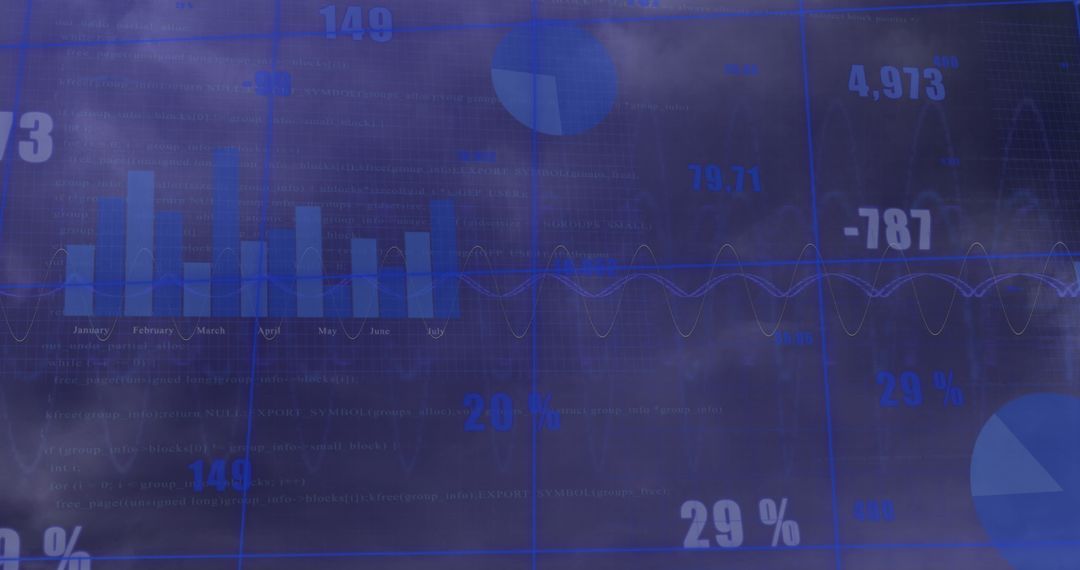
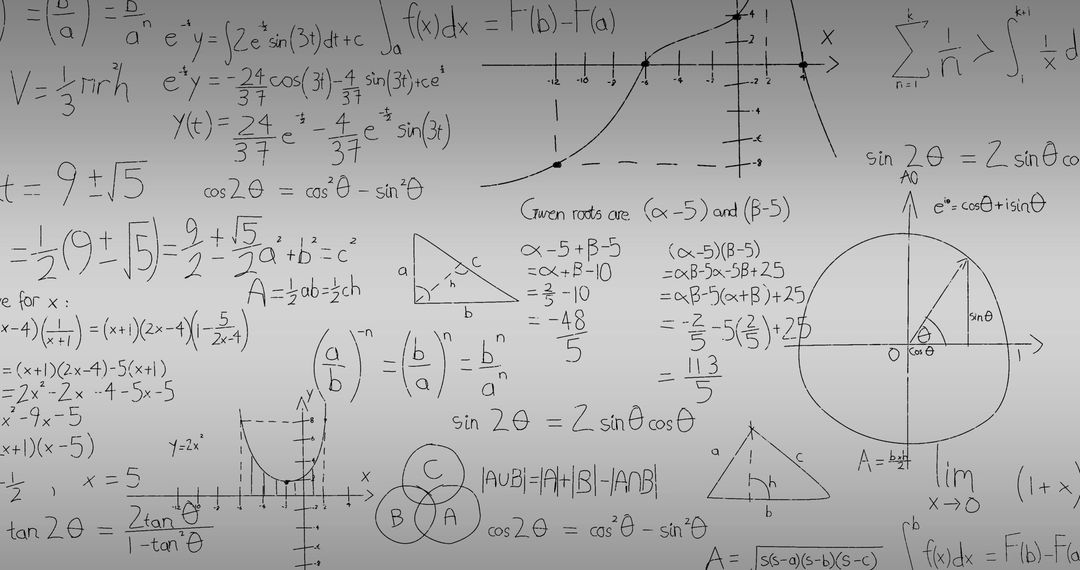
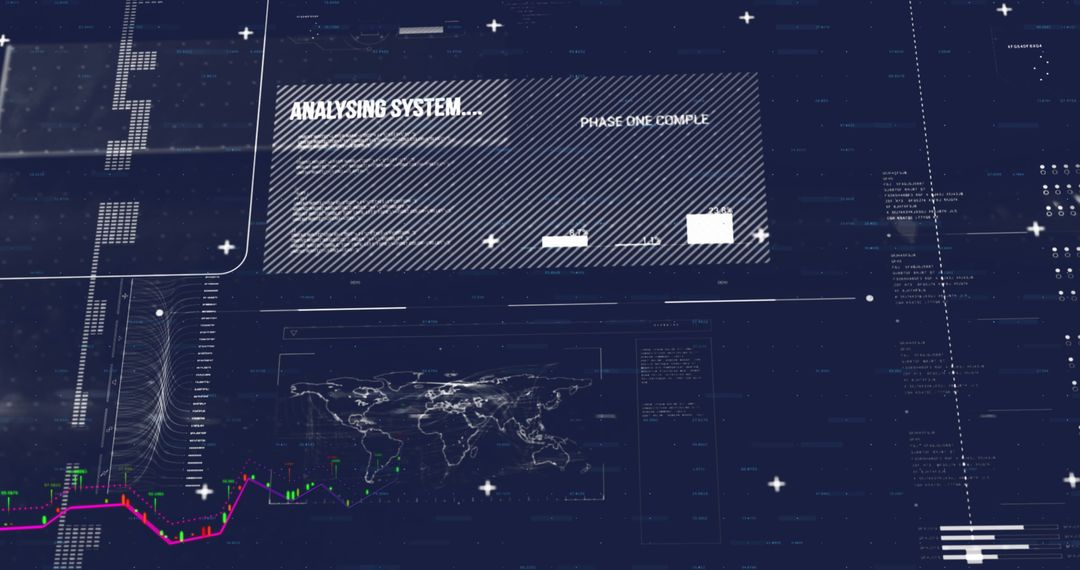
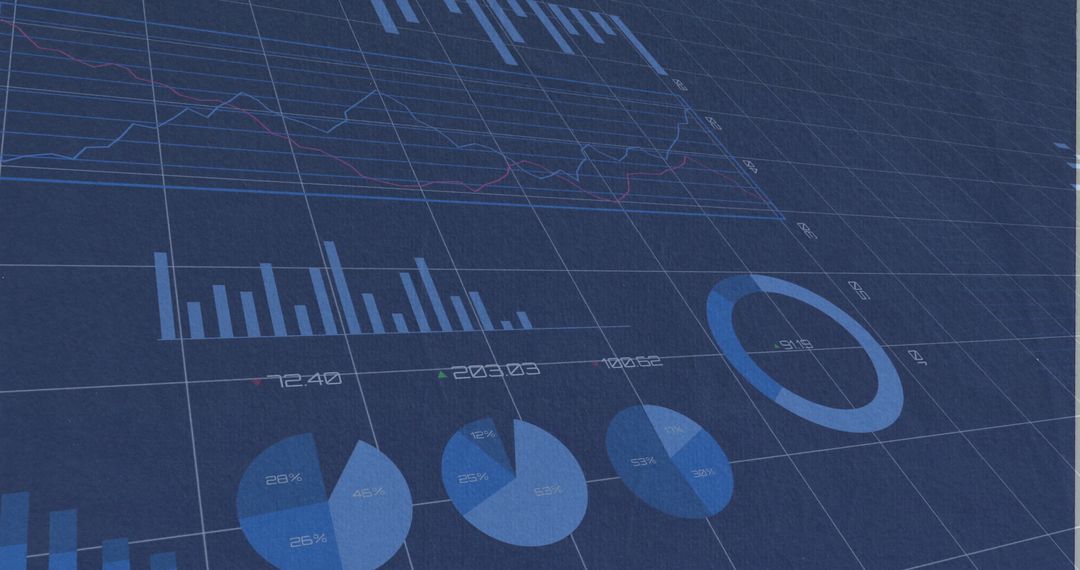
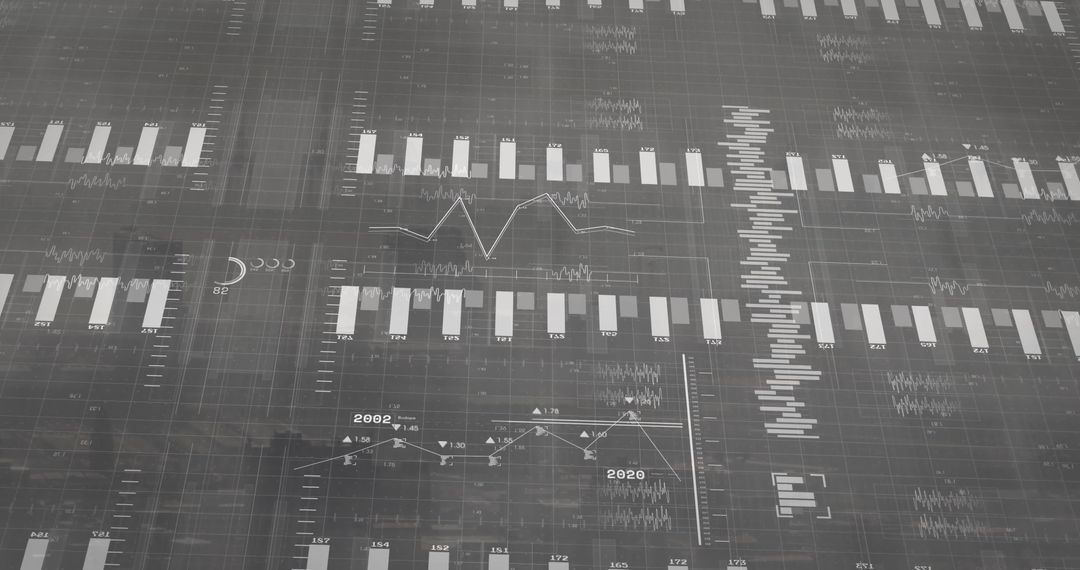
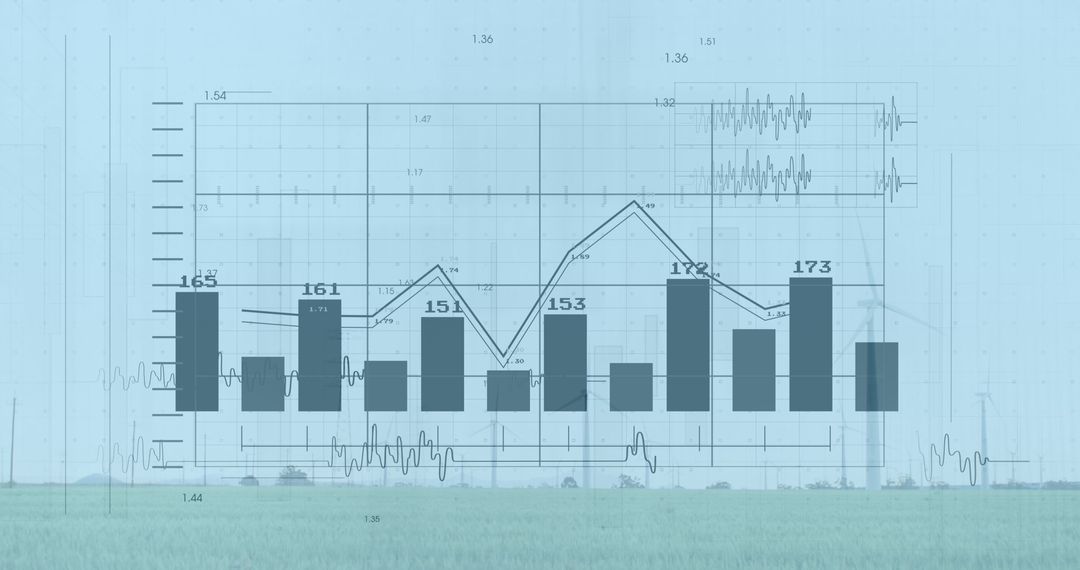
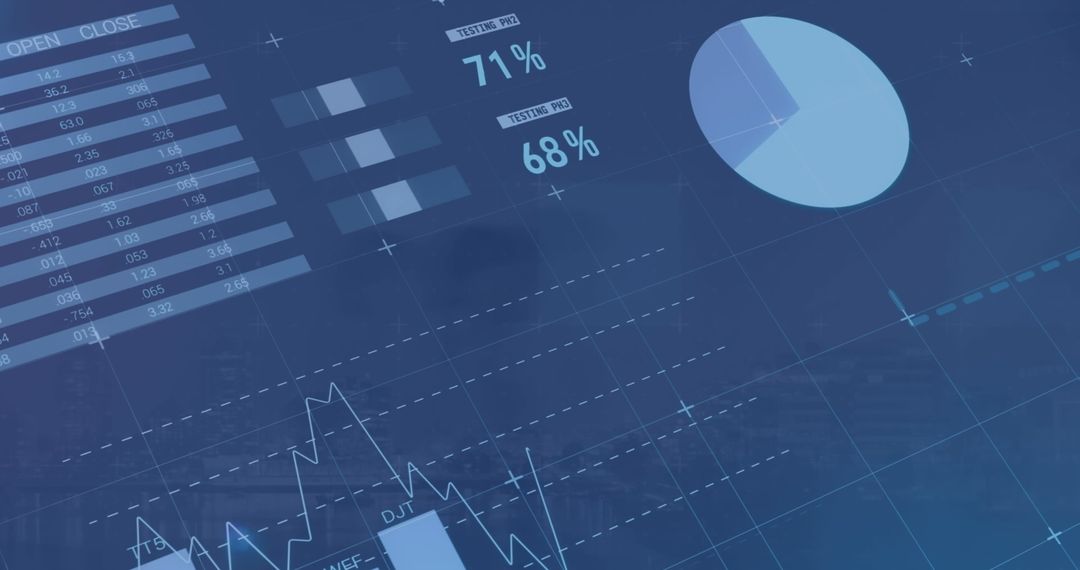
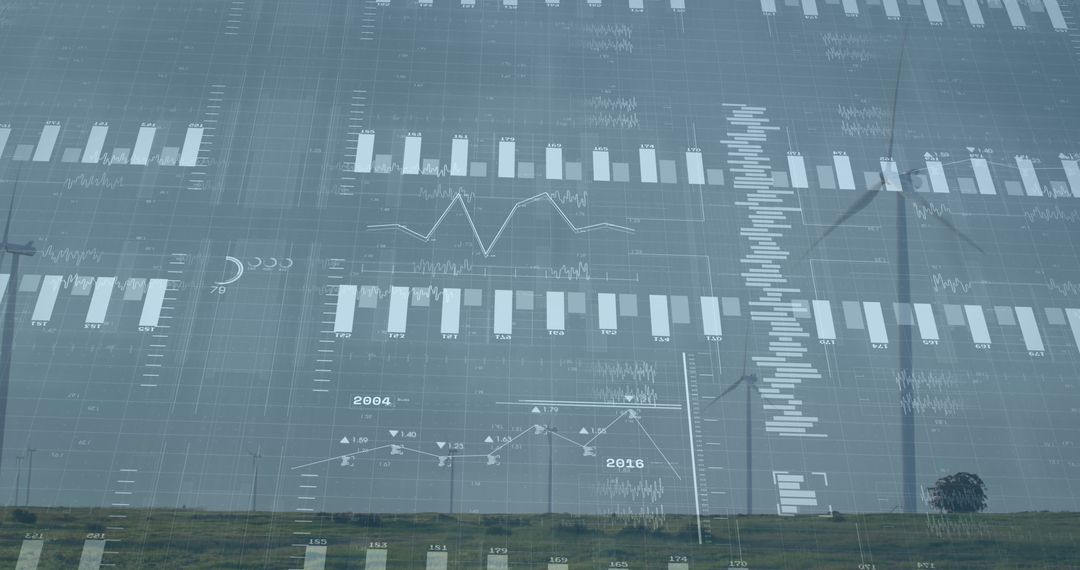
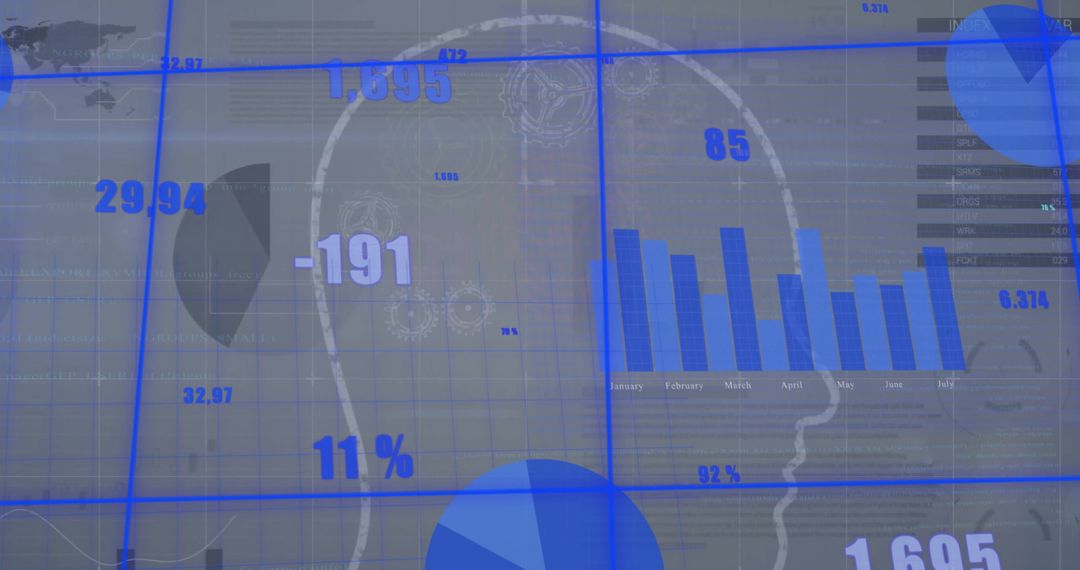
- Composite Visualization of Renewable Energy Site Analytics and Charts
Composite Visualization of Renewable Energy Site Analytics and Charts Image
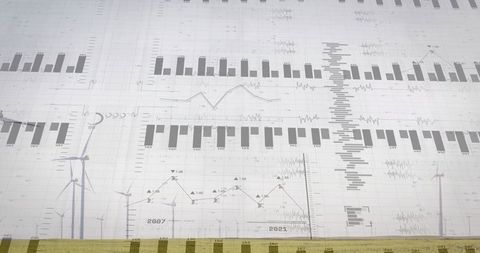
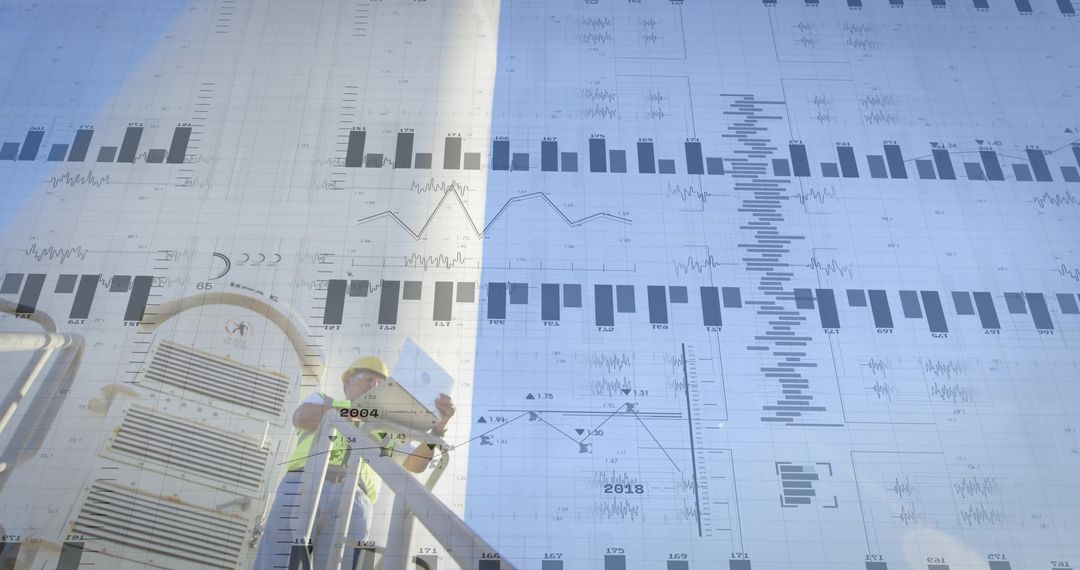
This complex blend of data visualization and imagery of a rural energy site prominently featuring wind turbines offers a dynamic perspective on renewable energy analytics and sustainability efforts. Ideal for use in presentations, reports, or publications about renewable energy, environmental issues, or digital innovation, this image effectively combines visual data and real-world scenarios. It highlights the interconnectedness of modern technology and sustainable development, appealing to industries focused on green innovation and energy management.
Powered by  - Get 15% off with code: PIKWIZARD15


0
downloads
downloads
Tags:
More
Credit Photo
If you would like to credit the Photo, here are some ways you can do so
Text Link
photo Link
<span class="text-link">
<span>
<a target="_blank" href=https://pikwizard.com/photo/composite-visualization-of-renewable-energy-site-analytics-and-charts/dc2cf7a7355400449416e13fc04af01d/>PikWizard</a>
</span>
</span>
<span class="image-link">
<span
style="margin: 0 0 20px 0; display: inline-block; vertical-align: middle; width: 100%;"
>
<a
target="_blank"
href="https://pikwizard.com/photo/composite-visualization-of-renewable-energy-site-analytics-and-charts/dc2cf7a7355400449416e13fc04af01d/"
style="text-decoration: none; font-size: 10px; margin: 0;"
>
<img src="https://pikwizard.com/pw/medium/dc2cf7a7355400449416e13fc04af01d.jpg" style="margin: 0; width: 100%;" alt="" />
<p style="font-size: 12px; margin: 0;">PikWizard</p>
</a>
</span>
</span>
Free (free of charge)
Free for personal and commercial use.
Author: Creative Art
Similar Free Stock Images

Premium


Premium


Premium


Premium


Premium


Premium


Premium


Premium


Premium


Premium


Premium

Premium


Premium


Premium


Premium


Premium


Premium


Premium


Premium


Premium


Premium


Premium


Premium


Premium