- Home >
- Stock Photos >
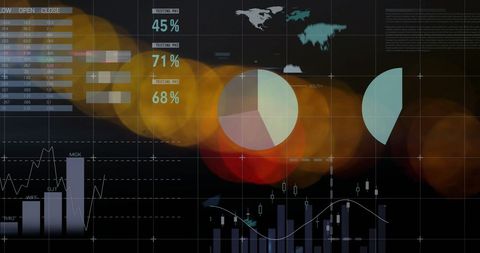
- Comprehensive Digital Analytics Dashboard with Graphs and Stats
Comprehensive Digital Analytics Dashboard with Graphs and Stats Image

Displays digital analytics dashboard featuring data tables, percentage indicators, and charts for efficient tracking of complex metrics. Sophisticated financial and data analysis suitable for business presentations, reports, and technology interfaces. Particularly useful for financial analysts, business strategists, and data-driven decision making.

downloads
Tags:
More
Credit Photo
If you would like to credit the Photo, here are some ways you can do so
Text Link
photo Link
<span class="text-link">
<span>
<a target="_blank" href=https://pikwizard.com/photo/comprehensive-digital-analytics-dashboard-with-graphs-and-stats/4148ab1db4a6f09cf491db6a6ba1e430/>PikWizard</a>
</span>
</span>
<span class="image-link">
<span
style="margin: 0 0 20px 0; display: inline-block; vertical-align: middle; width: 100%;"
>
<a
target="_blank"
href="https://pikwizard.com/photo/comprehensive-digital-analytics-dashboard-with-graphs-and-stats/4148ab1db4a6f09cf491db6a6ba1e430/"
style="text-decoration: none; font-size: 10px; margin: 0;"
>
<img src="https://pikwizard.com/pw/medium/4148ab1db4a6f09cf491db6a6ba1e430.jpg" style="margin: 0; width: 100%;" alt="" />
<p style="font-size: 12px; margin: 0;">PikWizard</p>
</a>
</span>
</span>
Free (free of charge)
Free for personal and commercial use.
Author: People Creations