
- Home >
- Stock Photos >
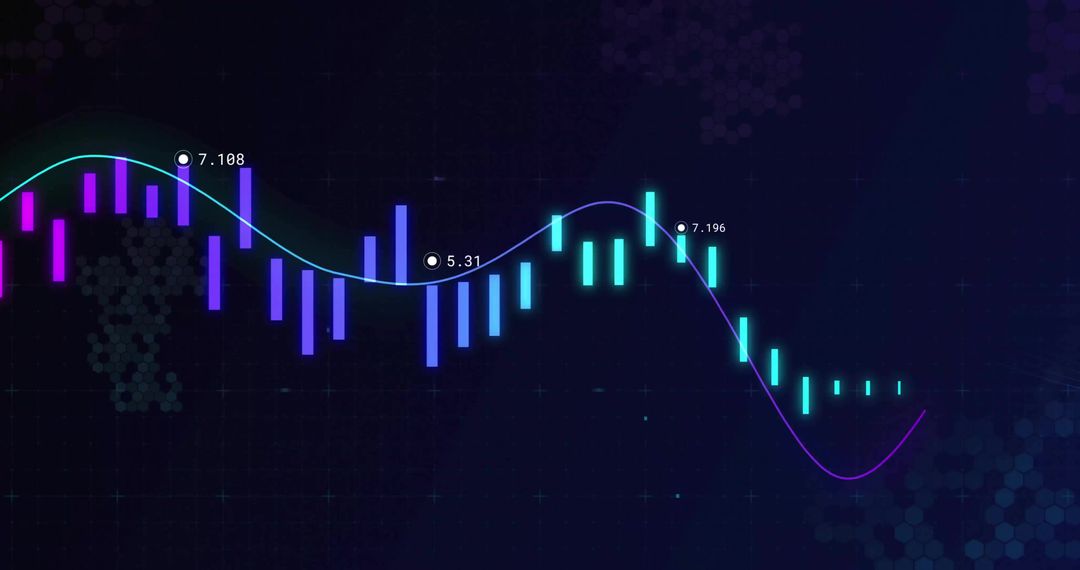
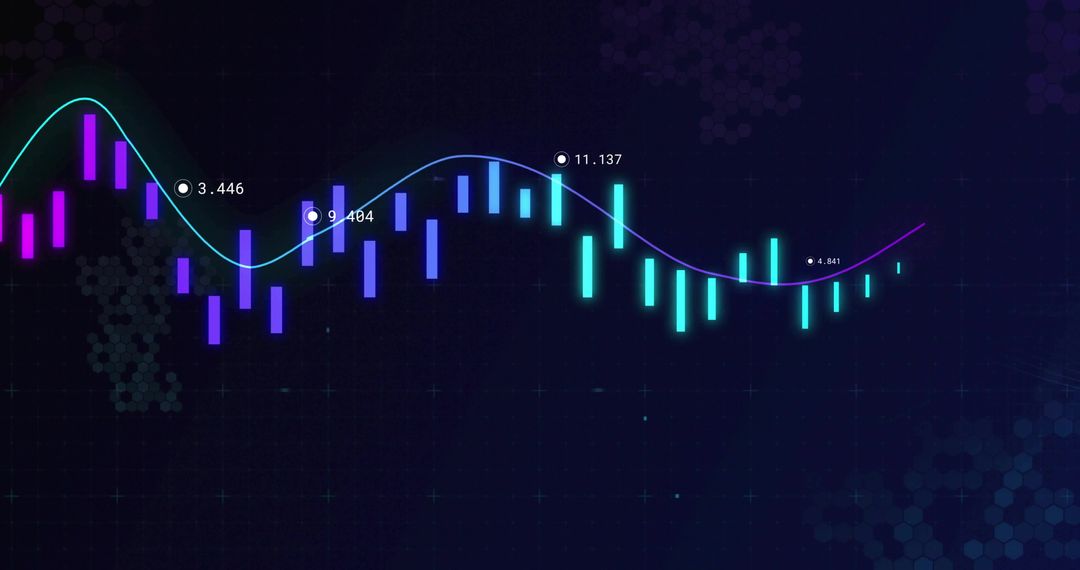
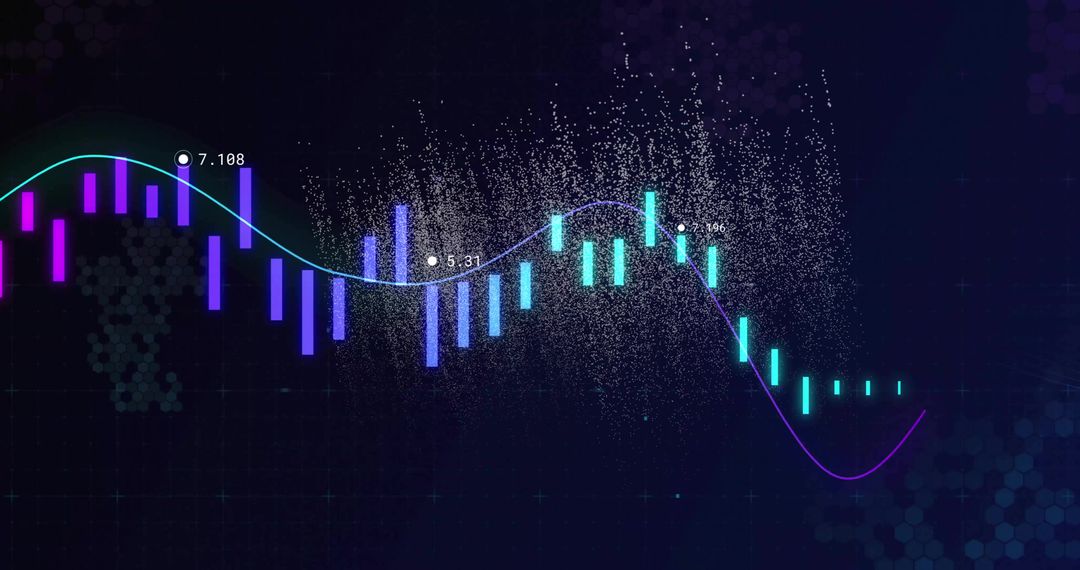
- Concentric HUD Overlay on Candlestick Chart with Blue Trend Line and Analytics Dashboard
Concentric HUD Overlay on Candlestick Chart with Blue Trend Line and Analytics Dashboard Image

Featuring concentric circular HUD reticle overlaying candlestick chart with cyan candles, blue trend line, numeric labels and hexagon pattern. Serving as high-tech background for fintech websites, trading platforms, financial presentations, data analytics dashboards, investor reports, marketing campaigns, UI mockups, video intros and social media posts. Conveying precision, modern technology and data-driven decision making; center reticle providing focal point for overlays like logos, headlines or KPI metrics. Color palette featuring deep navy, cyan and electric blue for strong contrast on dark layouts; wide composition fitting headers, banners and presentation slides.
Powered by  - Get 15% off with code: PIKWIZARD15


0
downloads
downloads
Tags:
More
Credit Photo
If you would like to credit the Photo, here are some ways you can do so
Text Link
photo Link
<span class="text-link">
<span>
<a target="_blank" href=https://pikwizard.com/photo/concentric-hud-overlay-on-candlestick-chart-with-blue-trend-line-and-analytics-dashboard/73a6d53ed22ab0398de5e8b8e06f912d/>PikWizard</a>
</span>
</span>
<span class="image-link">
<span
style="margin: 0 0 20px 0; display: inline-block; vertical-align: middle; width: 100%;"
>
<a
target="_blank"
href="https://pikwizard.com/photo/concentric-hud-overlay-on-candlestick-chart-with-blue-trend-line-and-analytics-dashboard/73a6d53ed22ab0398de5e8b8e06f912d/"
style="text-decoration: none; font-size: 10px; margin: 0;"
>
<img src="https://pikwizard.com/pw/medium/73a6d53ed22ab0398de5e8b8e06f912d.jpg" style="margin: 0; width: 100%;" alt="" />
<p style="font-size: 12px; margin: 0;">PikWizard</p>
</a>
</span>
</span>
Free (free of charge)
Free for personal and commercial use.
Author: Creative Art
Similar Free Stock Images

Premium


Premium


Premium


Premium


Premium


Premium


Premium


Premium


Premium


Premium


Premium


Premium


Premium


Premium


Premium


Premium


Premium


Premium


Premium


Premium


Premium


Premium


Premium


Premium

