- Home >
- Stock Photos >
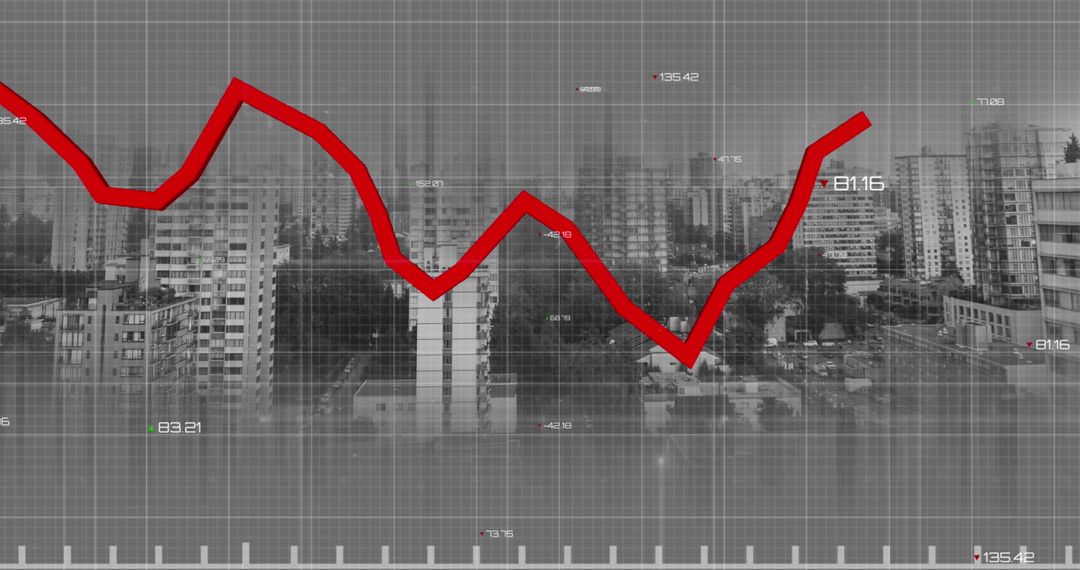
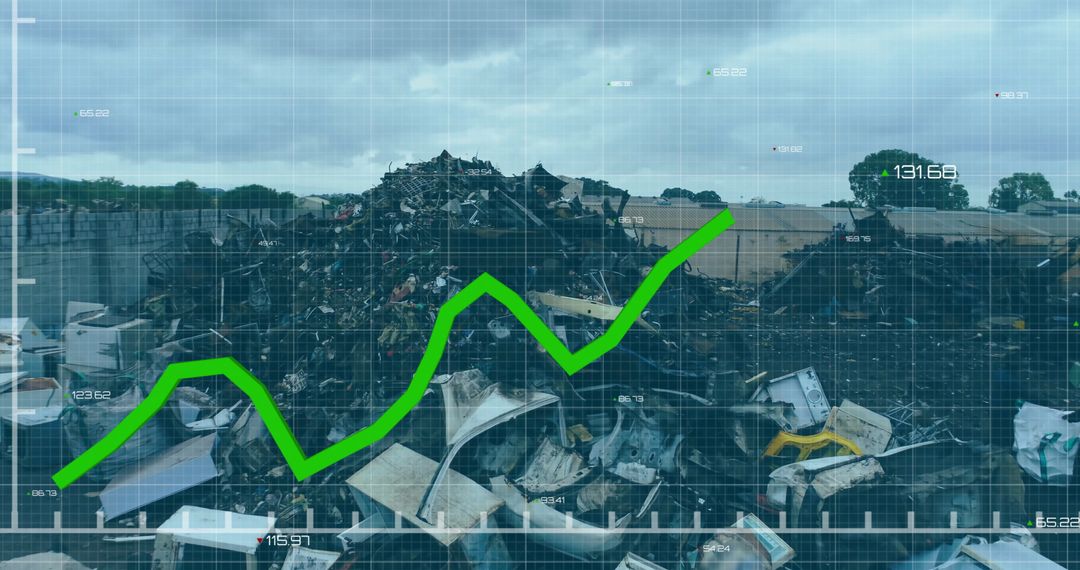
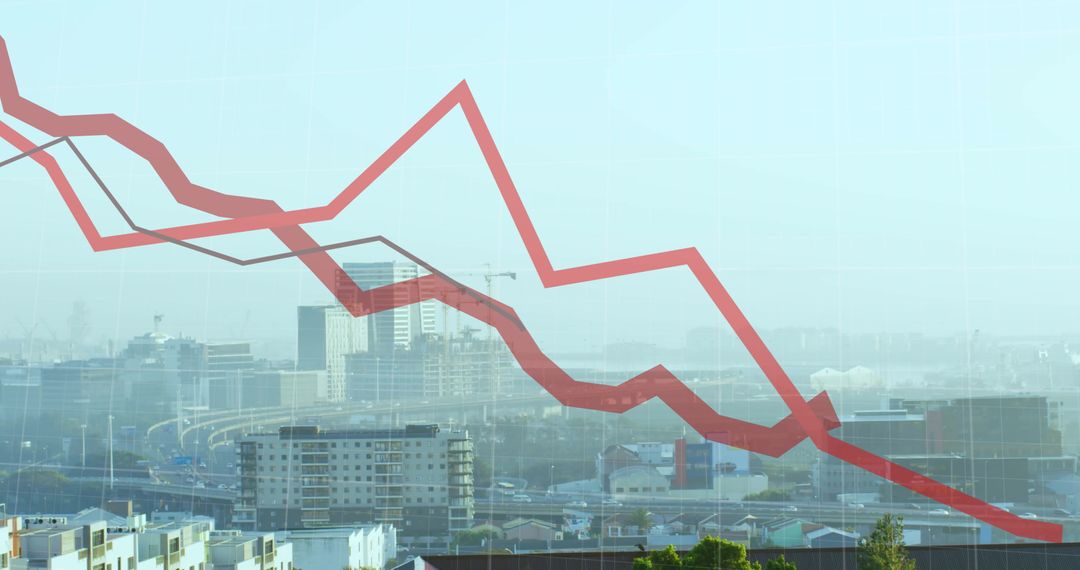
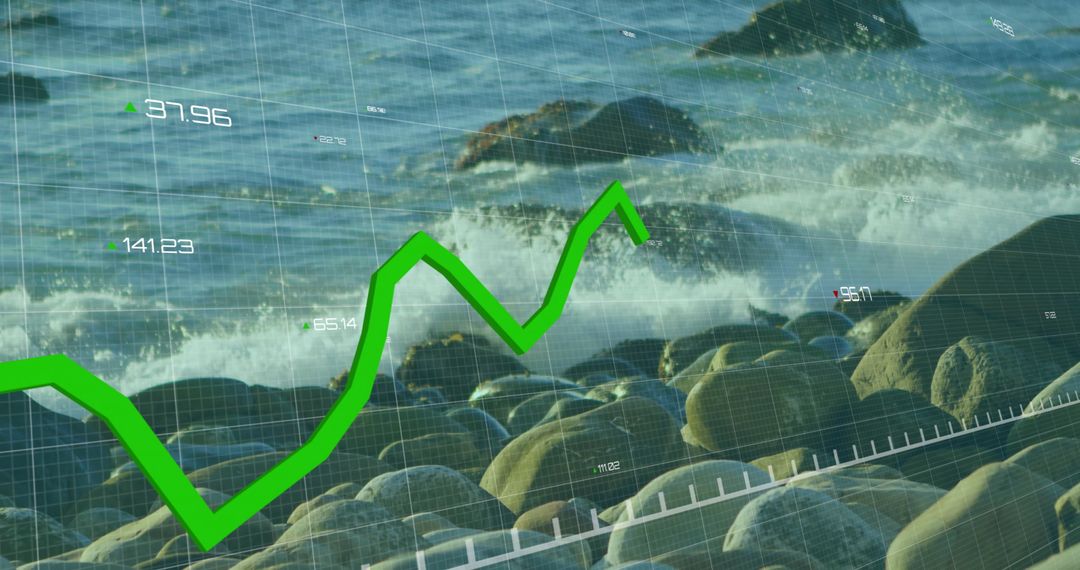
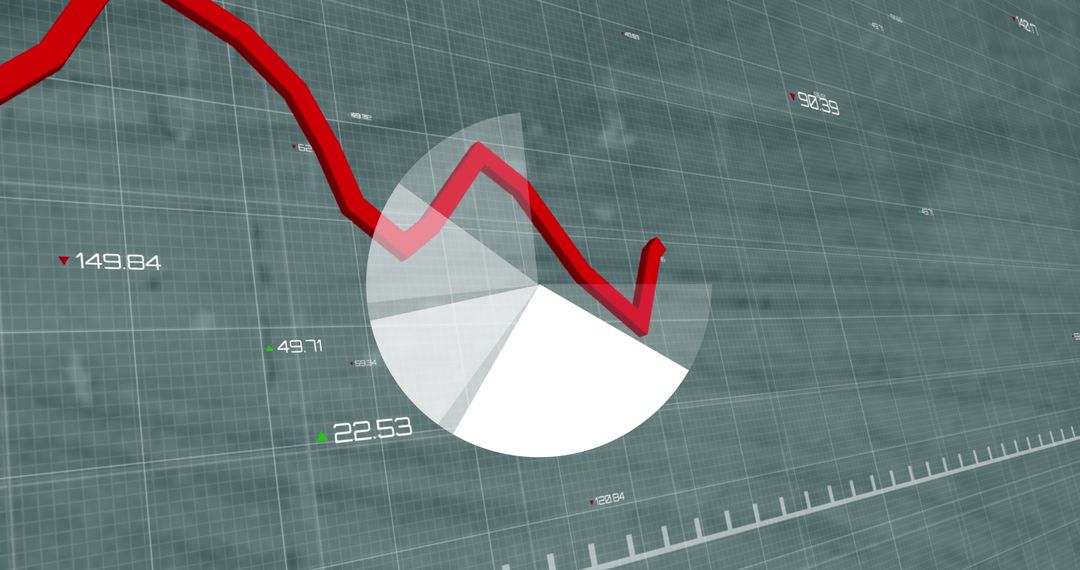
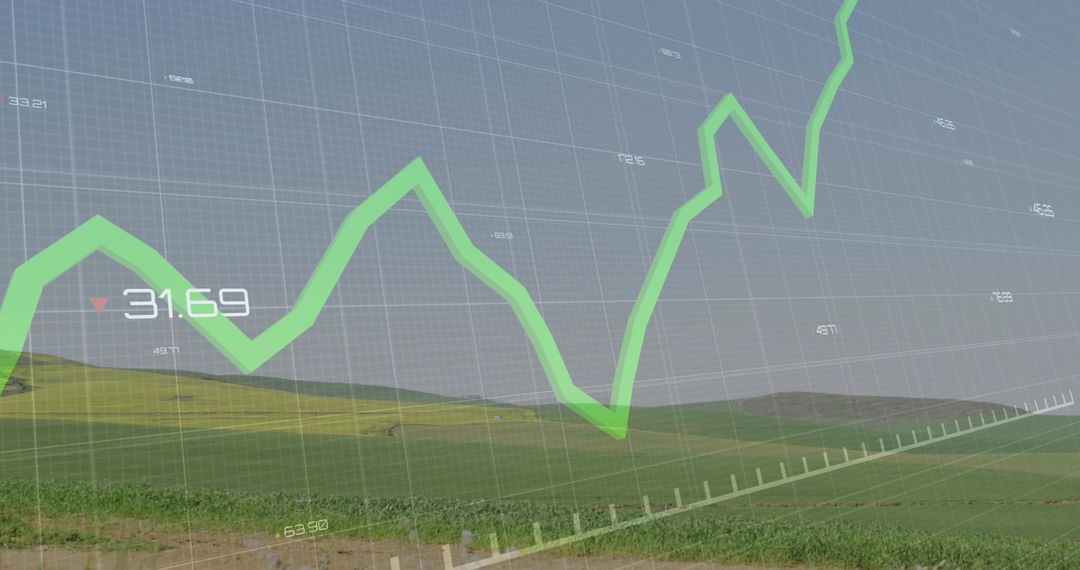
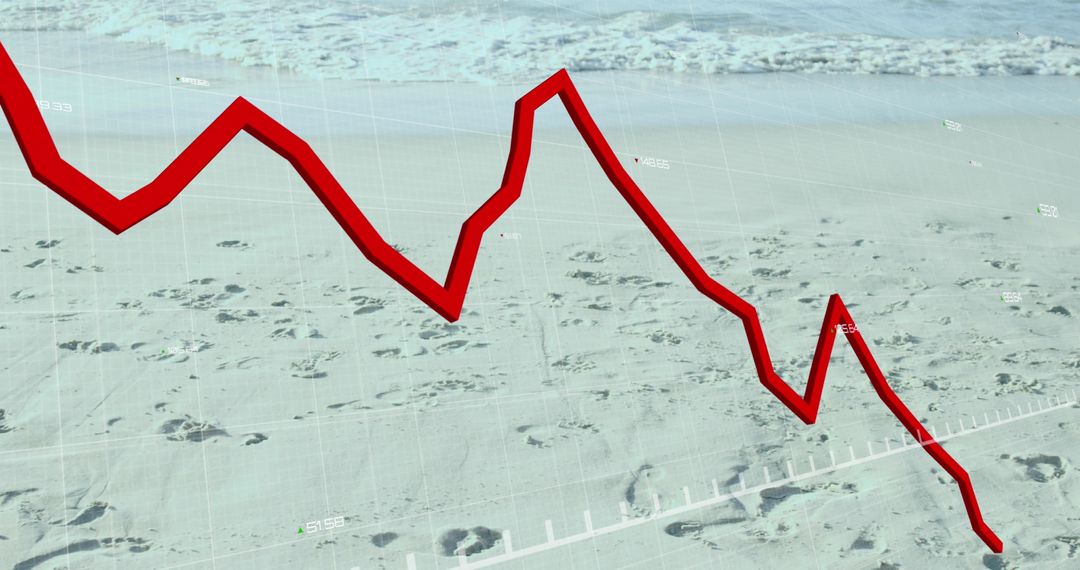
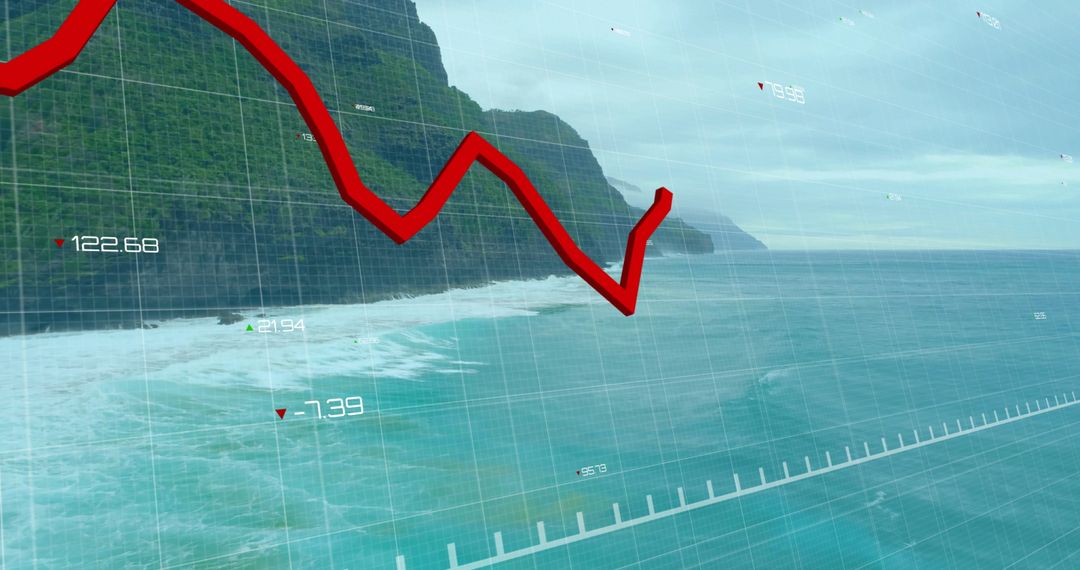
- Conceptual Line Graphs Highlighting Economic Decline over Pollution
Conceptual Line Graphs Highlighting Economic Decline over Pollution Image

Conceptual artwork merging graphs with an image of a dumping ground plated on an overcast sky illustrates the intersection of economic recession and environmental impact. Useful for projects exploring waste management economics, the impact of financial loss on environmental efforts, and analyzing the dichotomy between pollution and market setbacks.
Powered by  - Get 15% off with code: PIKWIZARD15


2
downloads
downloads
Tags:
More
Credit Photo
If you would like to credit the Photo, here are some ways you can do so
Text Link
photo Link
<span class="text-link">
<span>
<a target="_blank" href=https://pikwizard.com/photo/conceptual-line-graphs-highlighting-economic-decline-over-pollution/a390a2ce9ca03ab345643bcab6ee5af2/>PikWizard</a>
</span>
</span>
<span class="image-link">
<span
style="margin: 0 0 20px 0; display: inline-block; vertical-align: middle; width: 100%;"
>
<a
target="_blank"
href="https://pikwizard.com/photo/conceptual-line-graphs-highlighting-economic-decline-over-pollution/a390a2ce9ca03ab345643bcab6ee5af2/"
style="text-decoration: none; font-size: 10px; margin: 0;"
>
<img src="https://pikwizard.com/pw/medium/a390a2ce9ca03ab345643bcab6ee5af2.jpg" style="margin: 0; width: 100%;" alt="" />
<p style="font-size: 12px; margin: 0;">PikWizard</p>
</a>
</span>
</span>
Free (free of charge)
Free for personal and commercial use.
Author: Authentic Images
Similar Free Stock Images