
- Home >
- Stock Photos >
- Connected Line Graph with Numerical Tables in Technical Dashboard
Connected Line Graph with Numerical Tables in Technical Dashboard Image
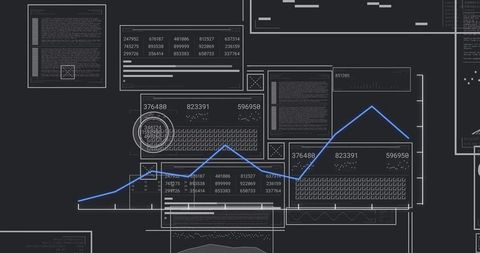
This represents a sophisticated data dashboard featuring a blue line graph with circular highlights indicating key data points. It integrates alongside numeric matrices and tables, presenting an intricate array of analytics and digital structure, fitting for professional environments dealing with data science, technical analyses or IT solutions. Useful for showcasing themes of Big Data, technical user experiences, or presentations related to analytics and trends in business contexts.
Powered by 


0
downloads
downloads
Tags:
More
Credit Photo
If you would like to credit the Photo, here are some ways you can do so
Text Link
photo Link
<span class="text-link">
<span>
<a target="_blank" href=https://pikwizard.com/photo/connected-line-graph-with-numerical-tables-in-technical-dashboard/ad00932dbcc30ec1c537787b90cd2045/>PikWizard</a>
</span>
</span>
<span class="image-link">
<span
style="margin: 0 0 20px 0; display: inline-block; vertical-align: middle; width: 100%;"
>
<a
target="_blank"
href="https://pikwizard.com/photo/connected-line-graph-with-numerical-tables-in-technical-dashboard/ad00932dbcc30ec1c537787b90cd2045/"
style="text-decoration: none; font-size: 10px; margin: 0;"
>
<img src="https://pikwizard.com/pw/medium/ad00932dbcc30ec1c537787b90cd2045.jpg" style="margin: 0; width: 100%;" alt="" />
<p style="font-size: 12px; margin: 0;">PikWizard</p>
</a>
</span>
</span>
Free (free of charge)
Free for personal and commercial use.
Author: Authentic Images