
- Home >
- Stock Photos >
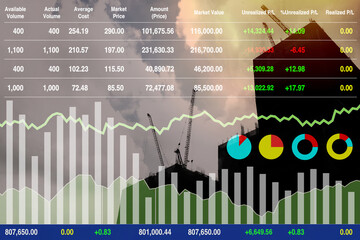
- Construction Crane Overlay with Stock Market Data Visualization
Construction Crane Overlay with Stock Market Data Visualization Image

The image depicts a construction crane with an overlay of stock market data and statistics. Dotted red, green, and white lines symbolize fluctuations in financial values. This symbolizes the intersection of commercial development and financial markets, highlighting themes in urban growth and investment. Useful for presentations on market trends in real estate or the impacts of financial data on infrastructure. Ideal for reports or articles on investment planning, economic development, or global market analysis.
Powered by 


downloads
Tags:
More
Credit Photo
If you would like to credit the Photo, here are some ways you can do so
Text Link
photo Link
<span class="text-link">
<span>
<a target="_blank" href=https://pikwizard.com/photo/construction-crane-overlay-with-stock-market-data-visualization/f23027e784e49ceb91054542f3cf50fa/>PikWizard</a>
</span>
</span>
<span class="image-link">
<span
style="margin: 0 0 20px 0; display: inline-block; vertical-align: middle; width: 100%;"
>
<a
target="_blank"
href="https://pikwizard.com/photo/construction-crane-overlay-with-stock-market-data-visualization/f23027e784e49ceb91054542f3cf50fa/"
style="text-decoration: none; font-size: 10px; margin: 0;"
>
<img src="https://pikwizard.com/pw/medium/f23027e784e49ceb91054542f3cf50fa.jpg" style="margin: 0; width: 100%;" alt="" />
<p style="font-size: 12px; margin: 0;">PikWizard</p>
</a>
</span>
</span>
Free (free of charge)
Free for personal and commercial use.
Author: Awesome Content
Similar Free Stock Images

Premium


Premium


Premium


Premium


Premium


Premium


Premium

Premium

Premium


Premium


Premium


Premium

Premium


Premium


Premium


Premium


Premium


Premium


Premium


Premium


Premium


Premium


Premium


Premium


Premium


Explore More Free Stock Images