- Home >
- Stock Photos >
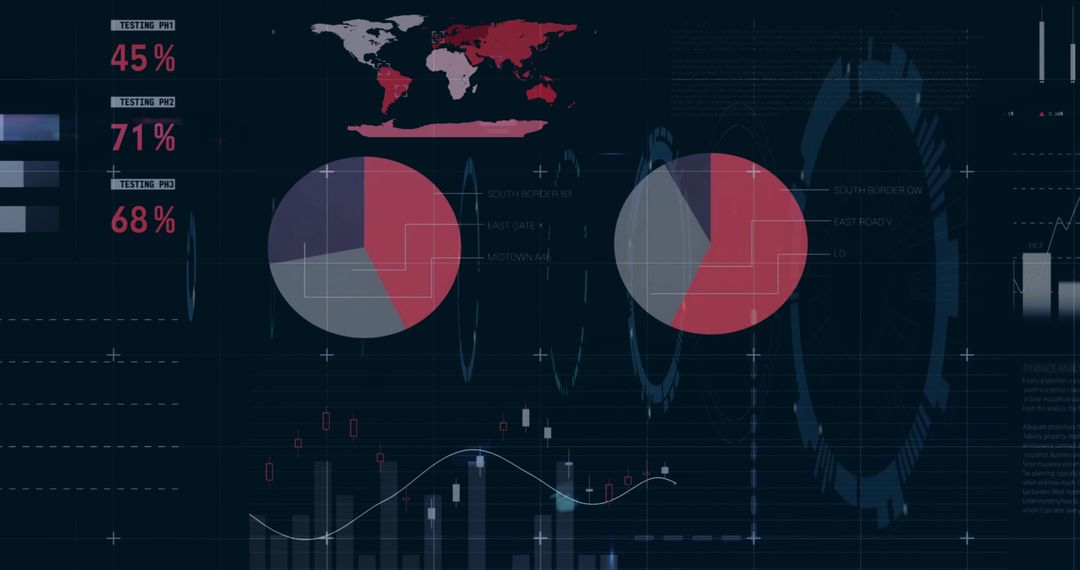
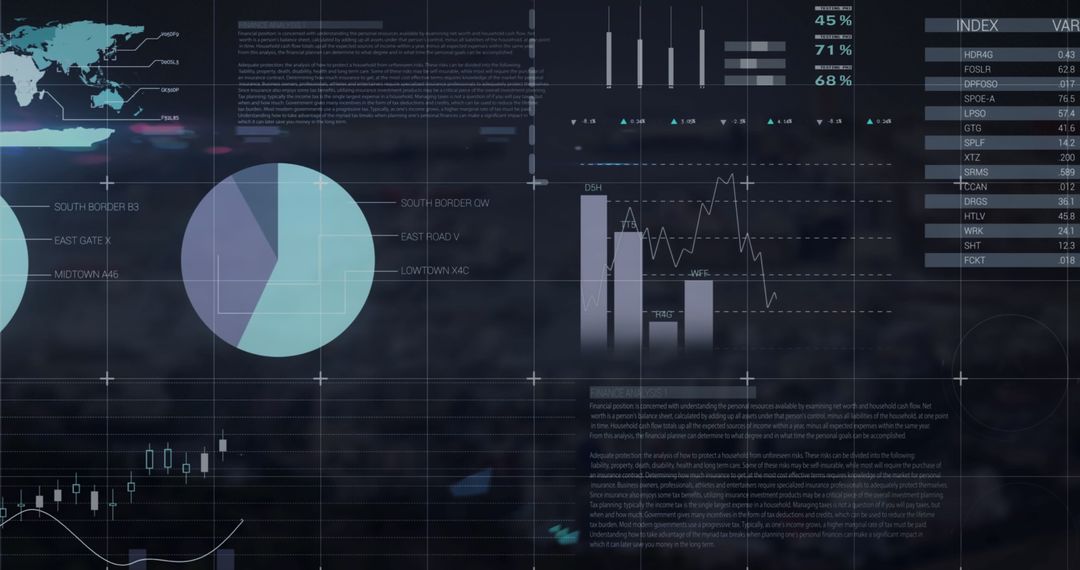
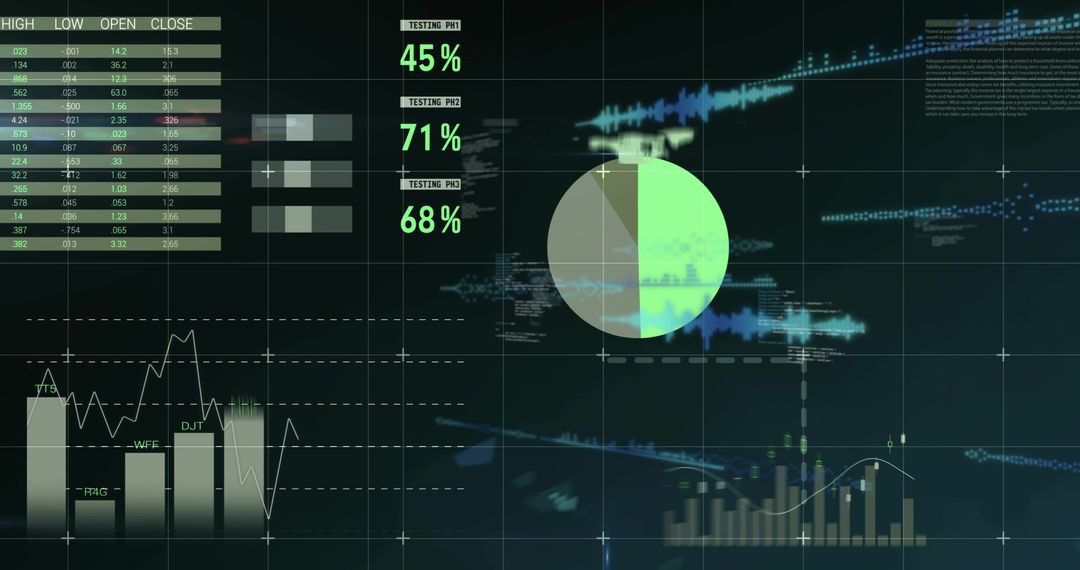
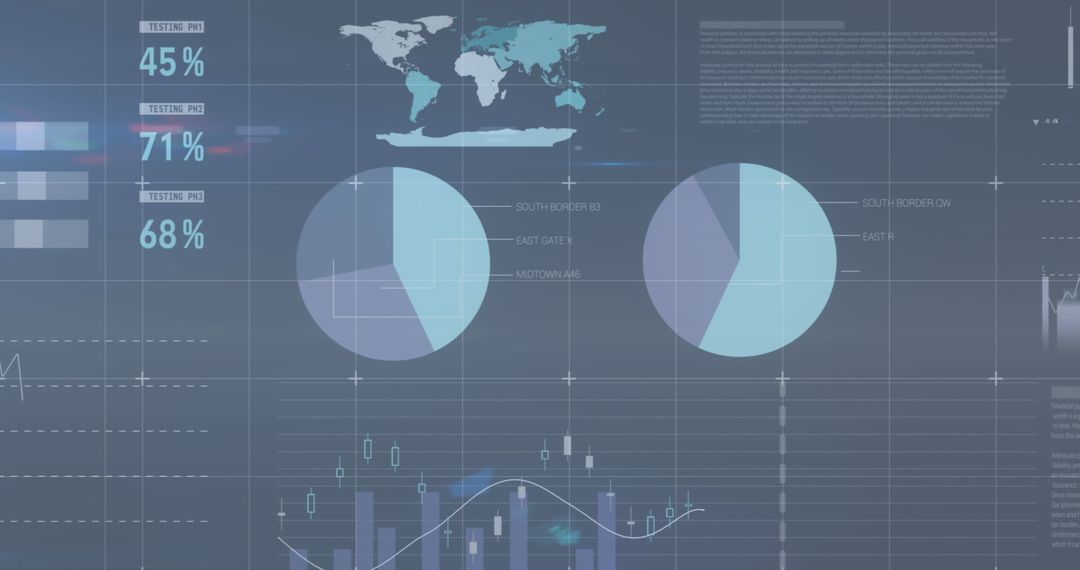
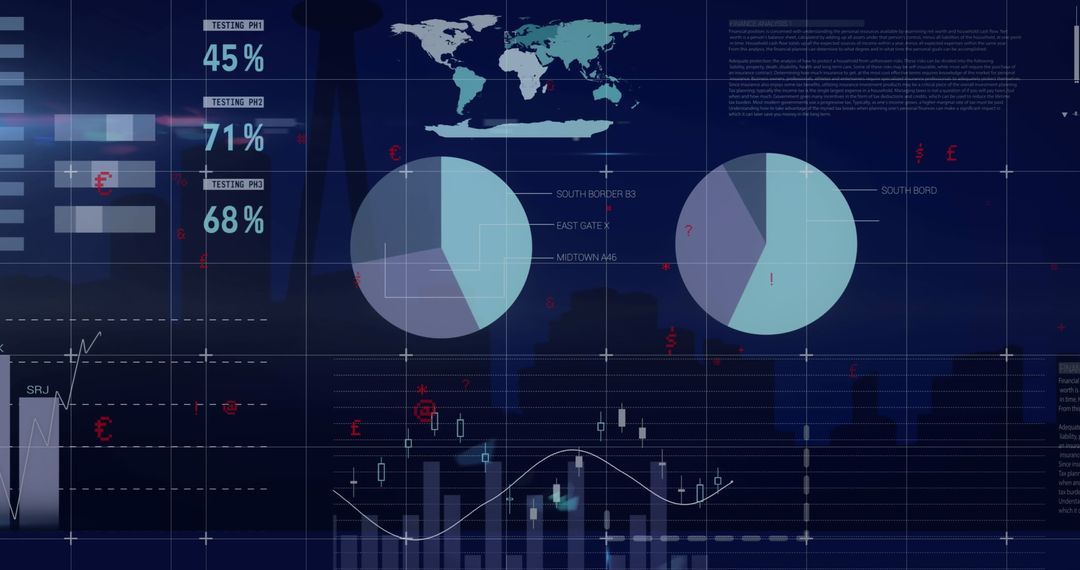
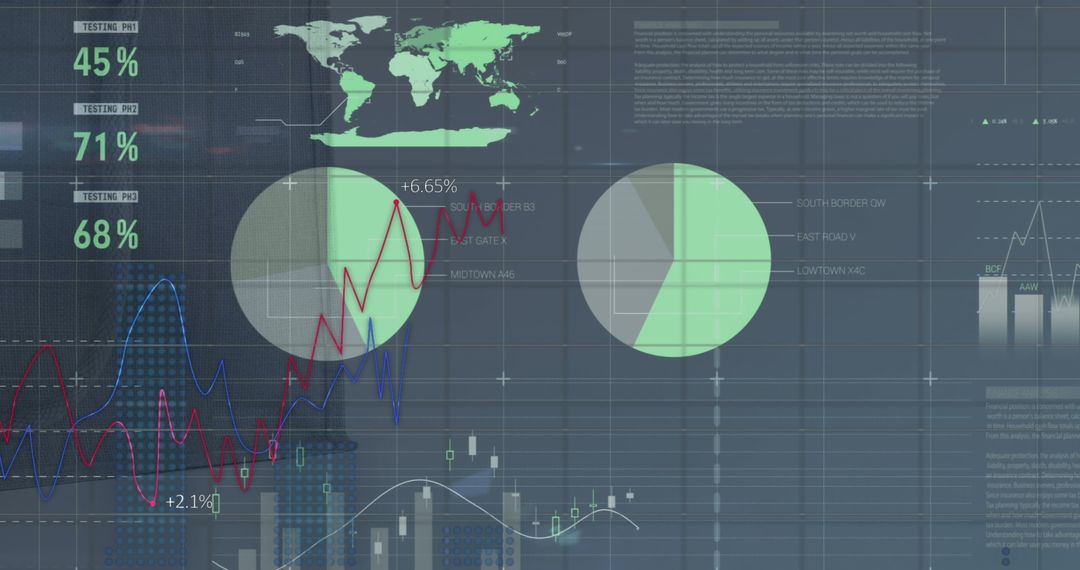
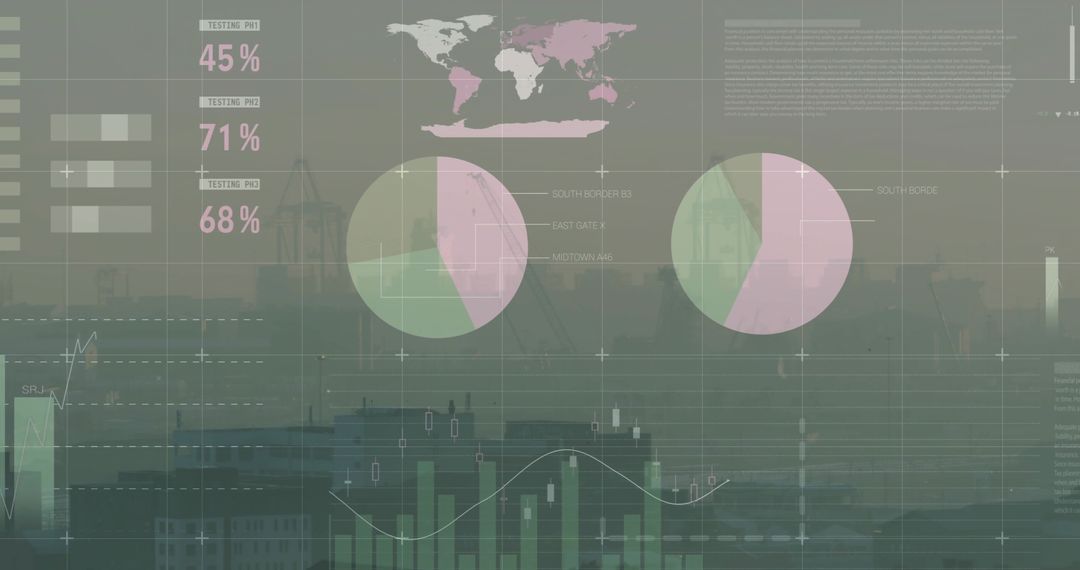
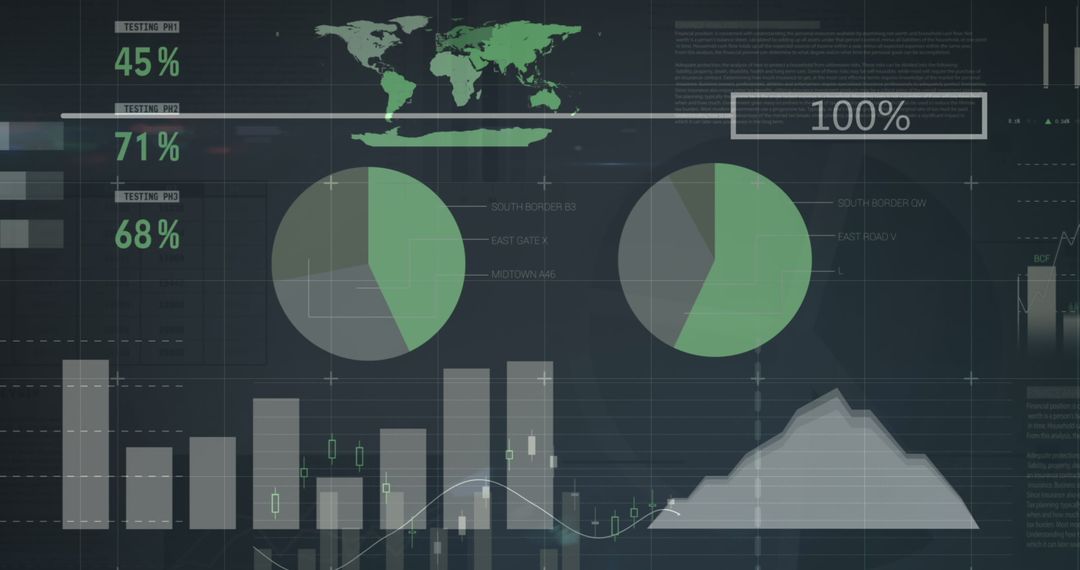
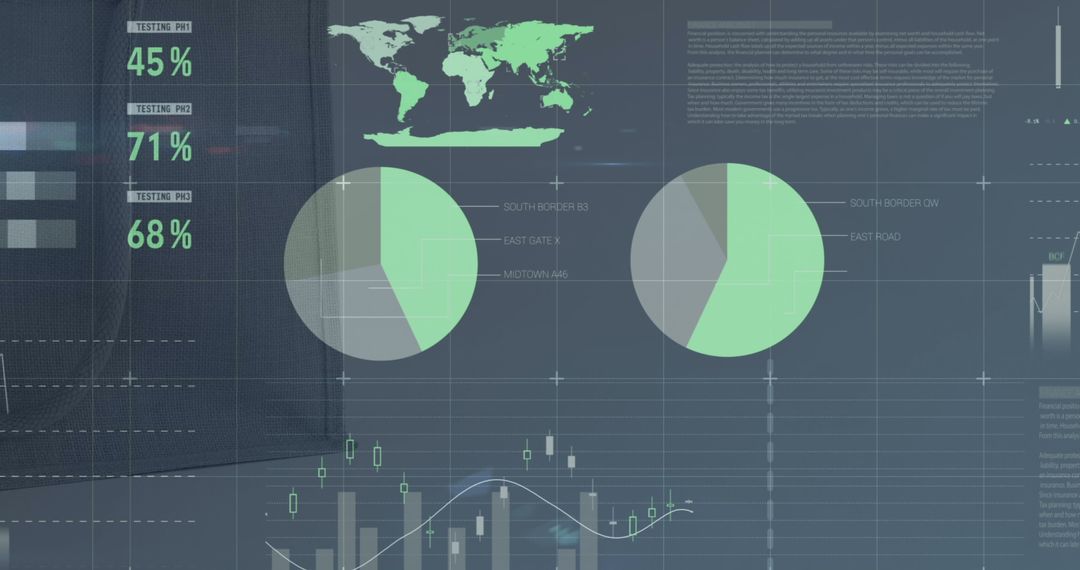
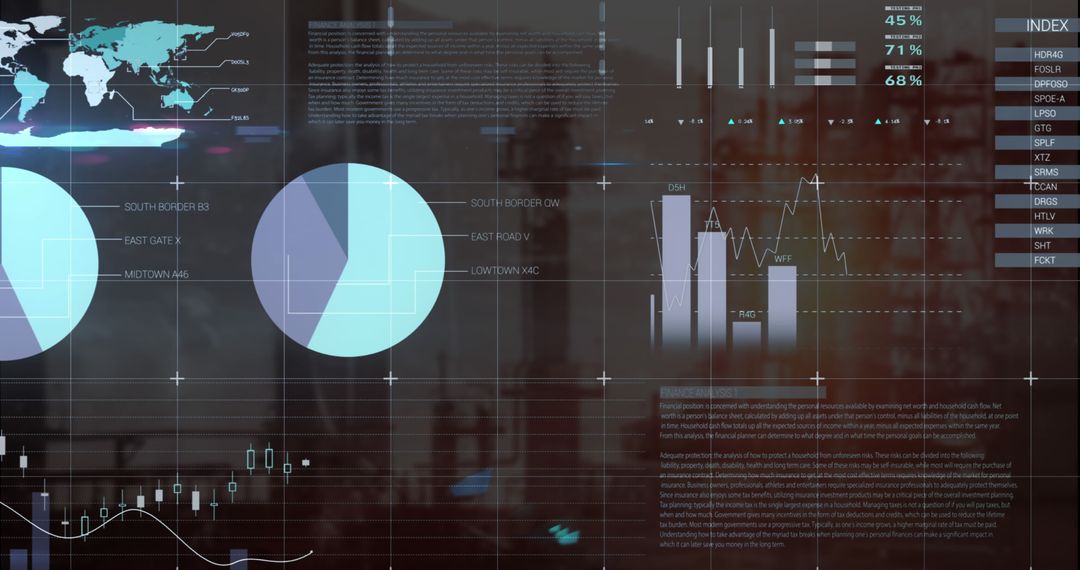
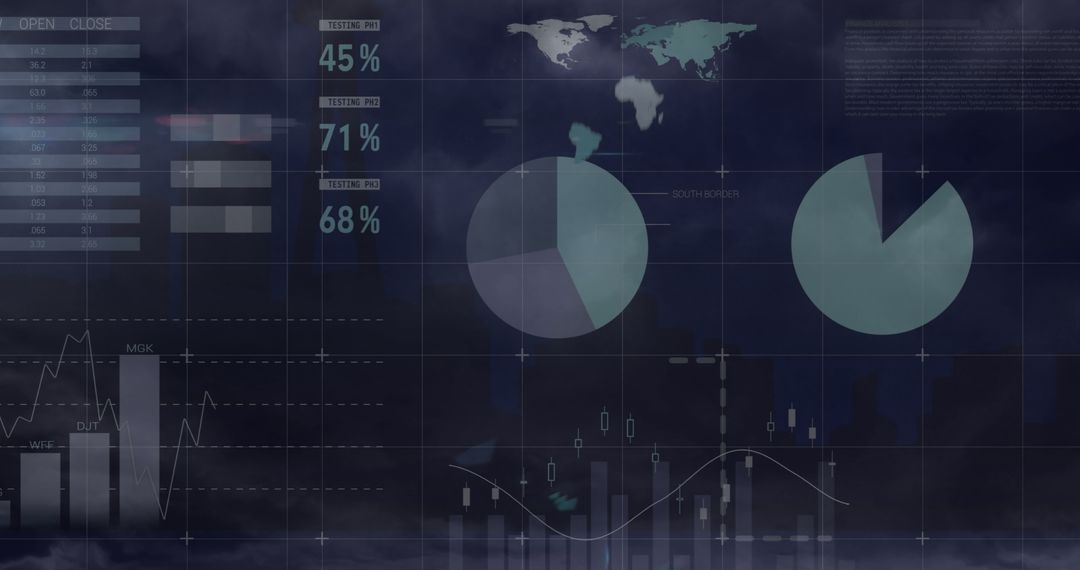
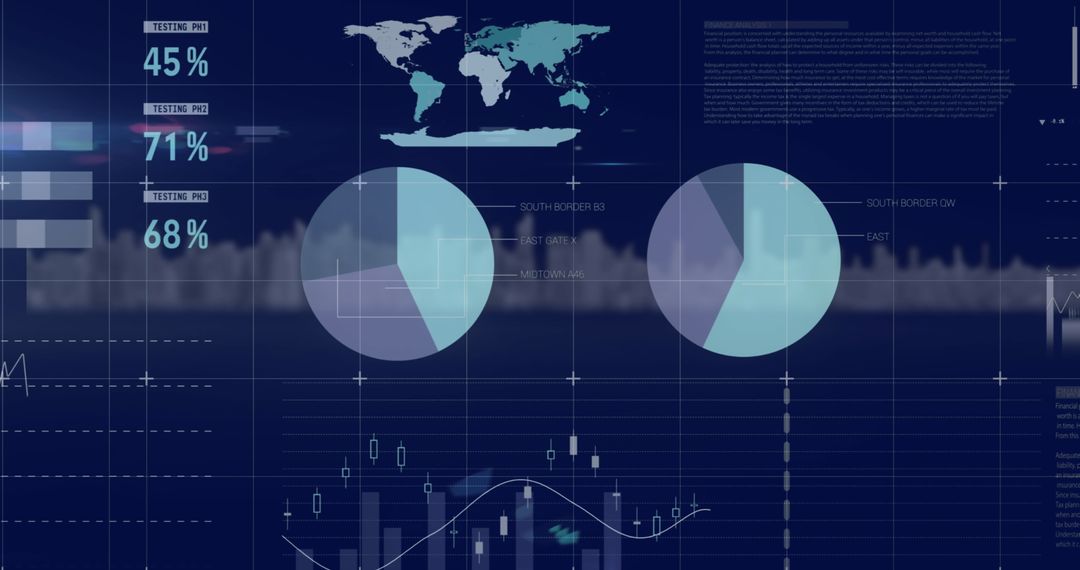
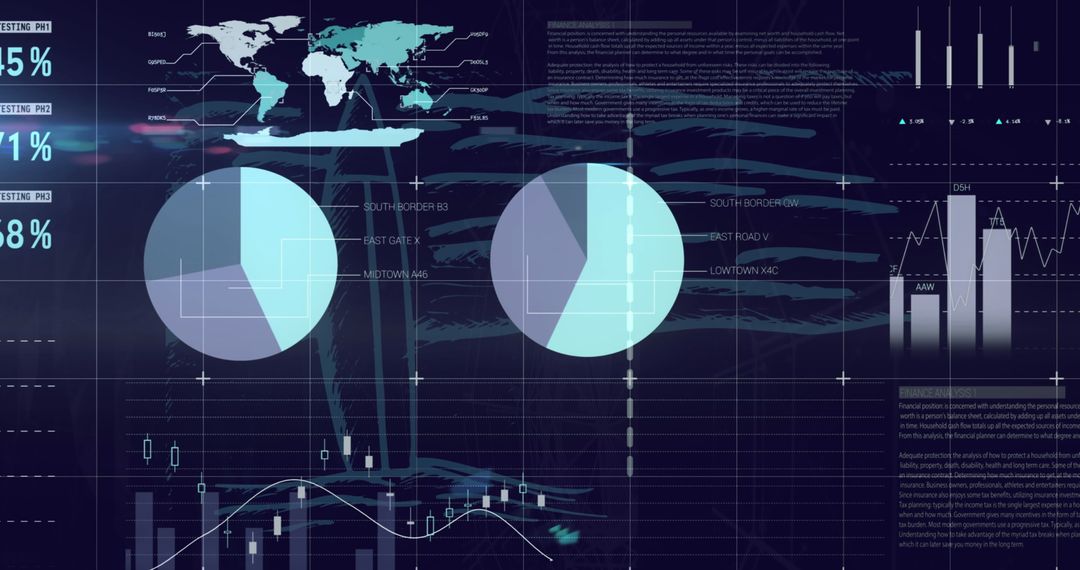
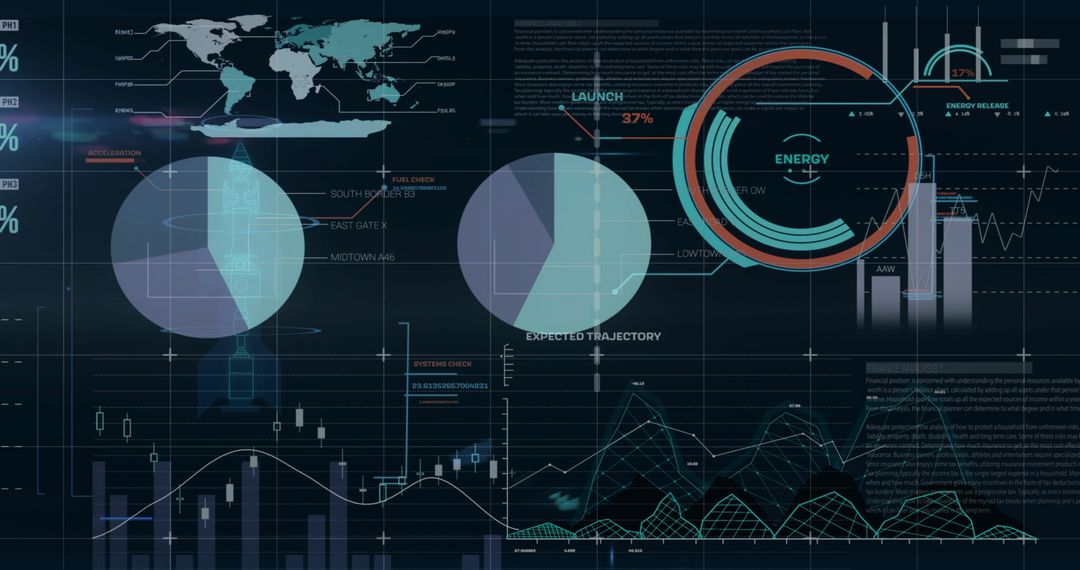
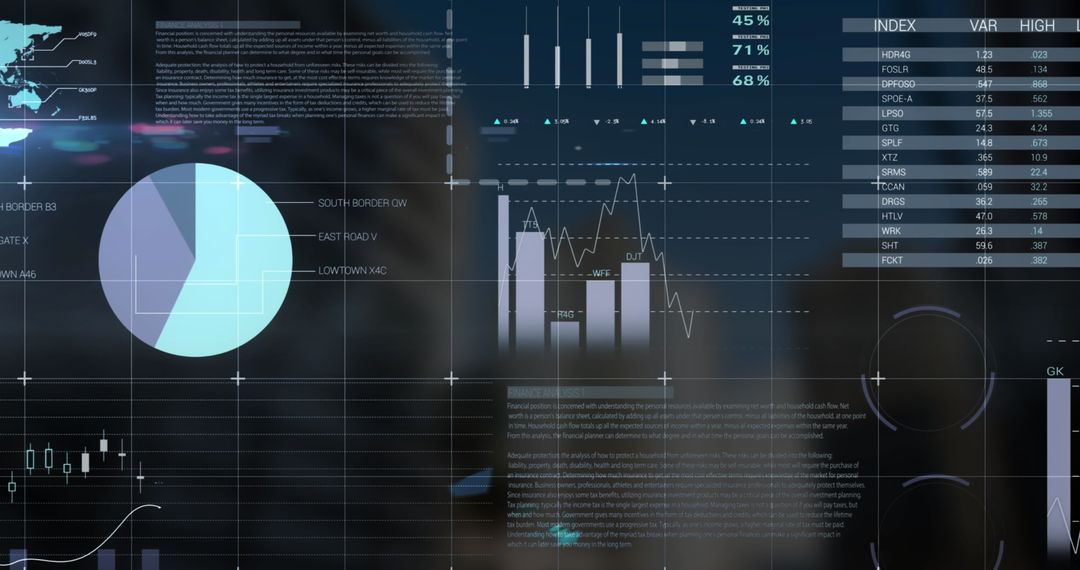
- Corporate analytics dashboard displaying global map, dual pie charts and financial data
Corporate analytics dashboard displaying global map, dual pie charts and financial data Image

Showing corporate analytics dashboard with world map, dual pie charts, bar graphs, candlestick lines and percentage metrics 45%, 71%, 68%. Featuring dark navy grid background, red and gray chart segments, thumbs-up icons and at-symbol overlays for social metrics. Serving corporate presentations, investor reports, annual results slides, marketing performance reviews and dashboard UI mockups. Supporting editorial and commercial projects focused on finance, analytics, data science, business intelligence and market research. Allowing customization for branding, KPI labels, localization, color adjustments and animated overlays for video; providing alternative crops for hero banners, slide backgrounds, social posts and infographic panels.
Powered by 


0
downloads
downloads
Tags:
More
Credit Photo
If you would like to credit the Photo, here are some ways you can do so
Text Link
photo Link
<span class="text-link">
<span>
<a target="_blank" href=https://pikwizard.com/photo/corporate-analytics-dashboard-displaying-global-map-dual-pie-charts-and-financial-data/3b6aea584d420238ccf532857d70b56e/>PikWizard</a>
</span>
</span>
<span class="image-link">
<span
style="margin: 0 0 20px 0; display: inline-block; vertical-align: middle; width: 100%;"
>
<a
target="_blank"
href="https://pikwizard.com/photo/corporate-analytics-dashboard-displaying-global-map-dual-pie-charts-and-financial-data/3b6aea584d420238ccf532857d70b56e/"
style="text-decoration: none; font-size: 10px; margin: 0;"
>
<img src="https://pikwizard.com/pw/medium/3b6aea584d420238ccf532857d70b56e.jpg" style="margin: 0; width: 100%;" alt="" />
<p style="font-size: 12px; margin: 0;">PikWizard</p>
</a>
</span>
</span>
Free (free of charge)
Free for personal and commercial use.
Author: Awesome Content
Similar Free Stock Images

Premium


Premium


Premium


Premium


Premium


Premium


Premium


Premium


Premium


Premium


Premium


Premium


Premium

Premium


Premium


Premium


Premium


Premium


Premium


Premium


Premium


Premium


Premium


Premium