- Home >
- Stock Photos >
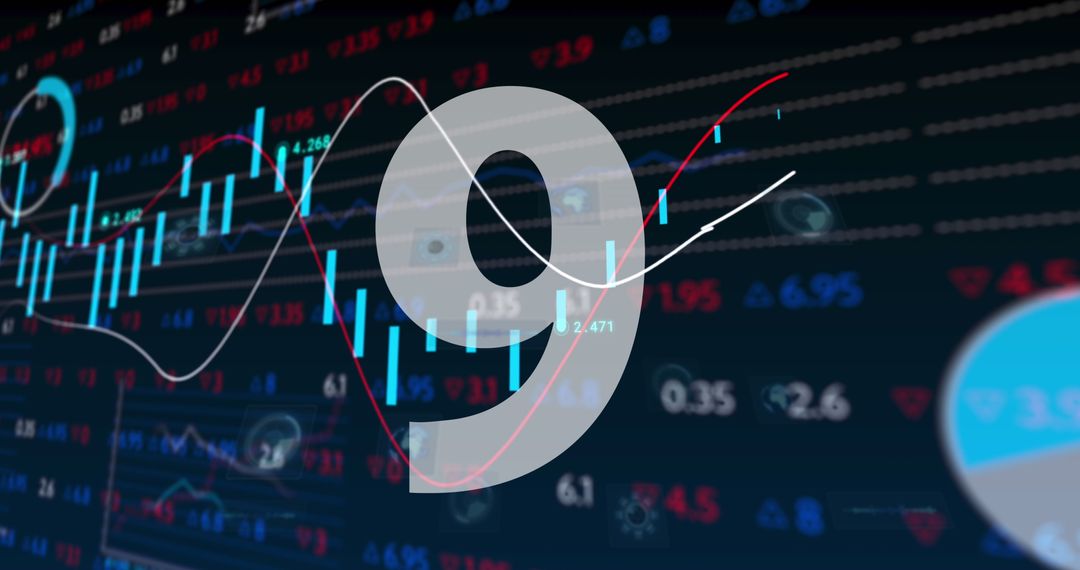
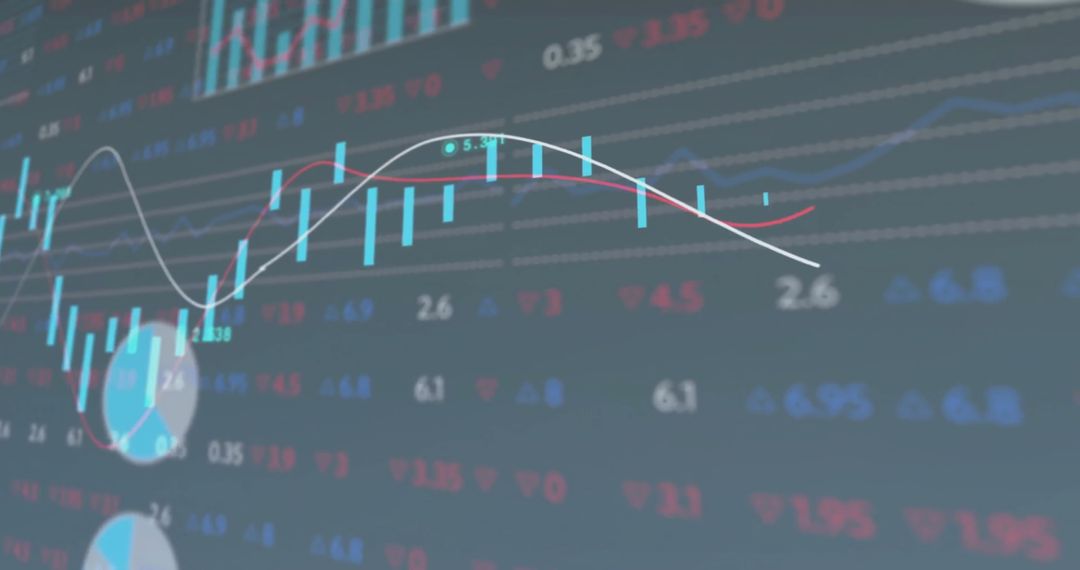
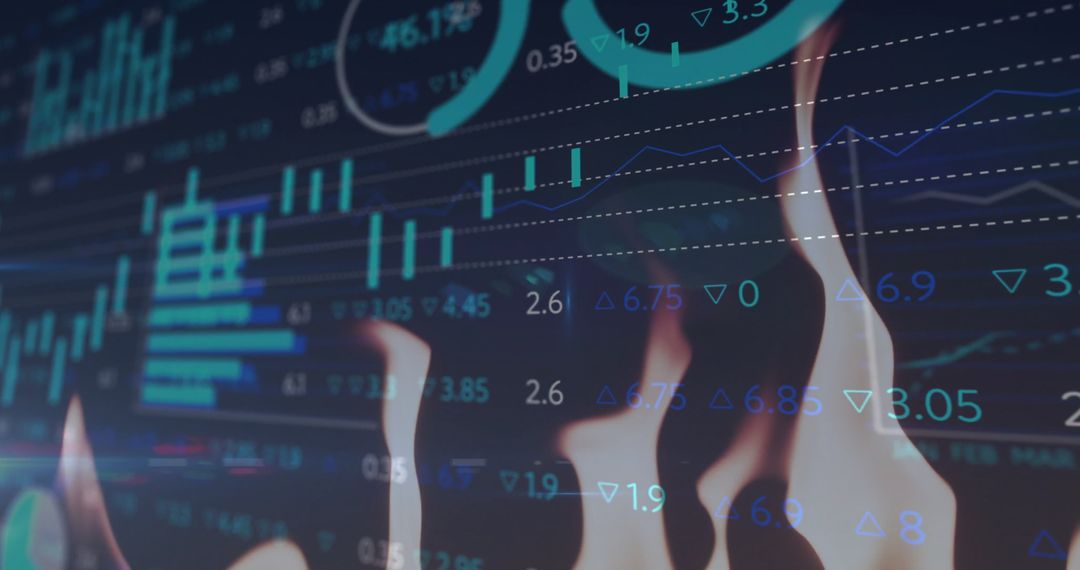
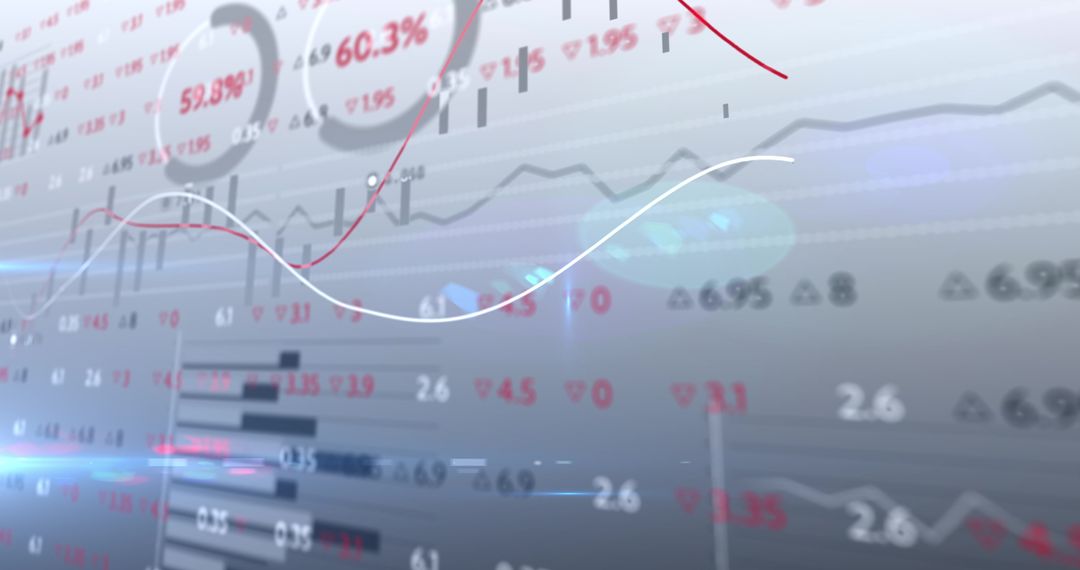
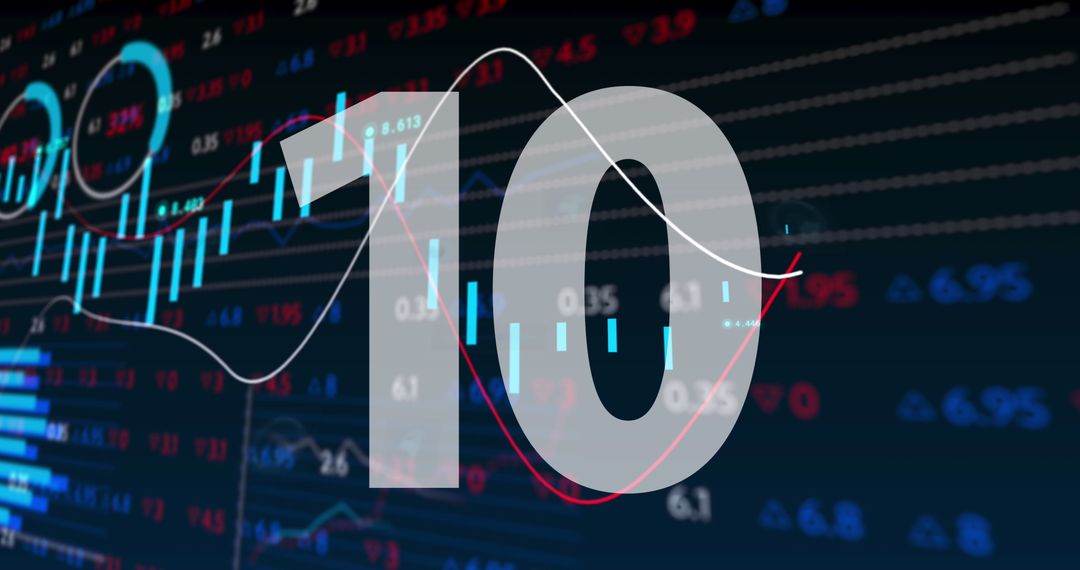
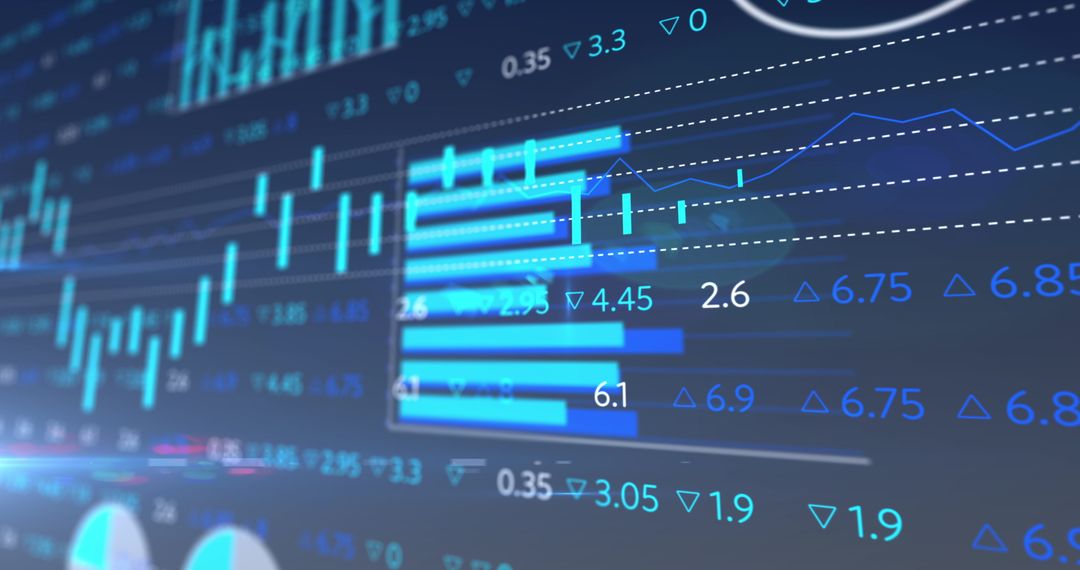
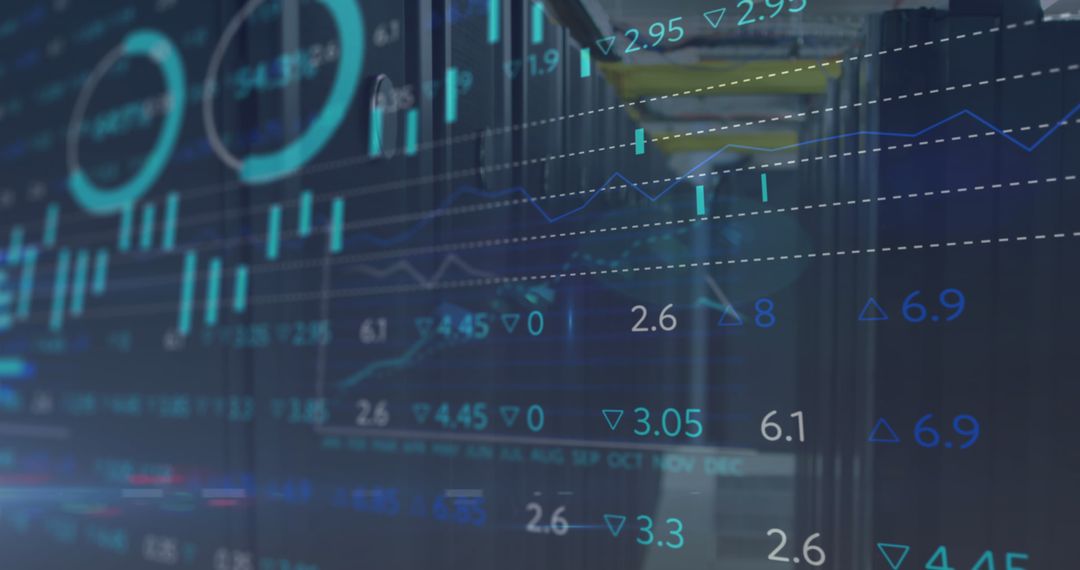
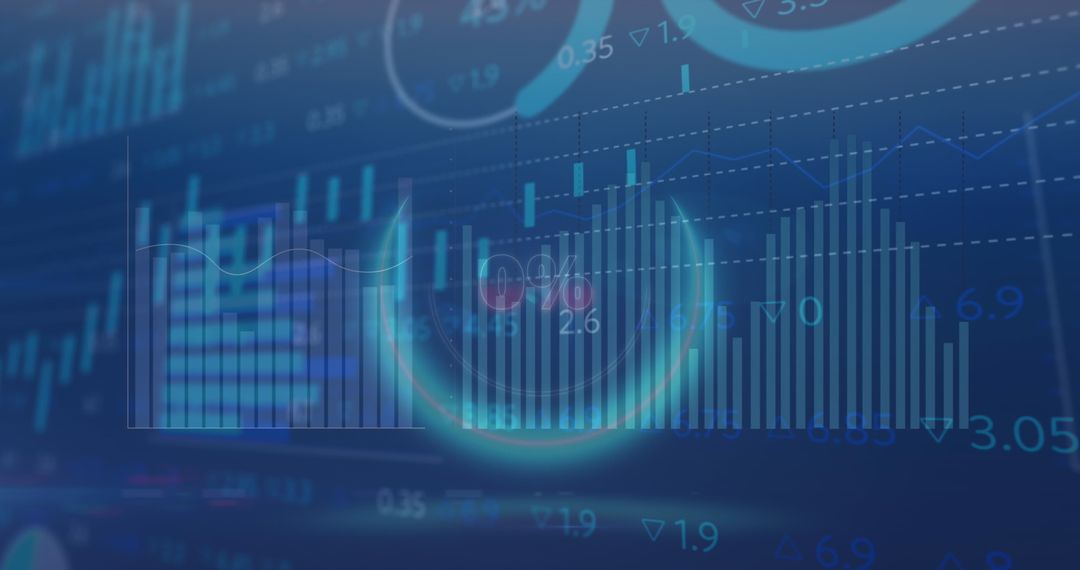
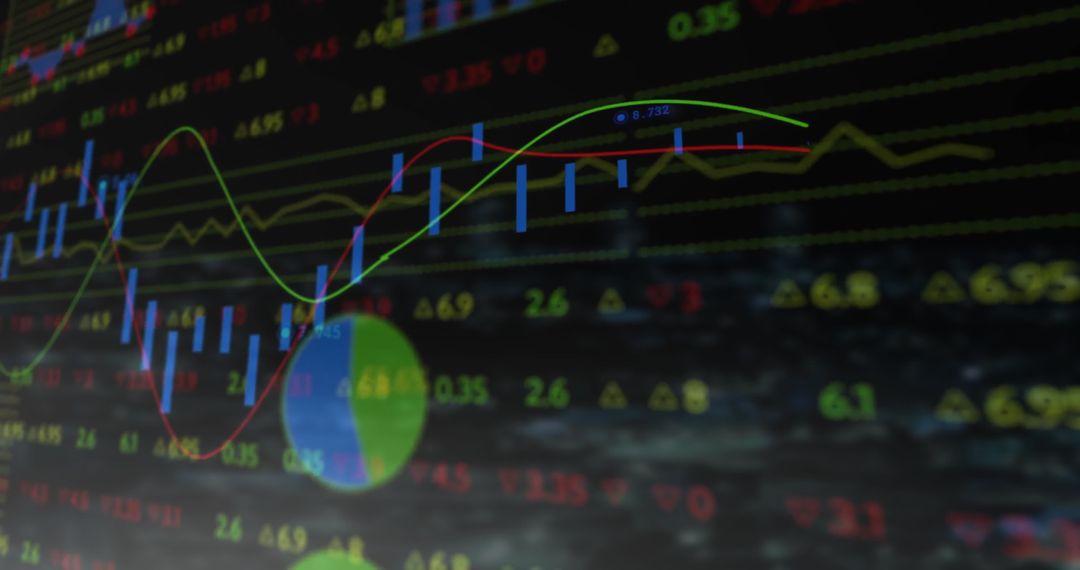
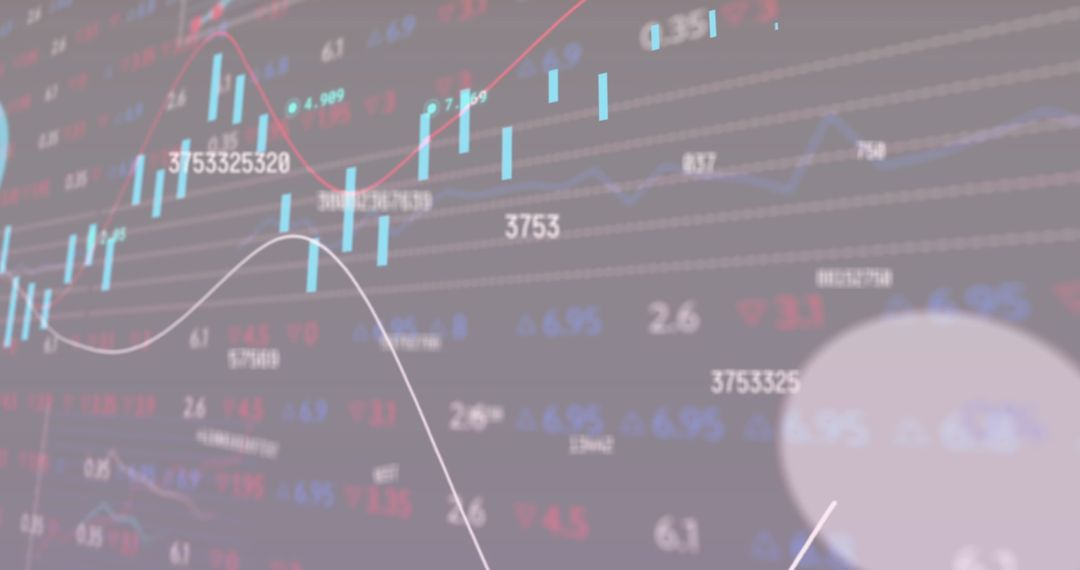
- Countdown and Data Analytics in Energetic Stock Market Visual
Countdown and Data Analytics in Energetic Stock Market Visual Image

Highlighting dynamic data flows with intense visual aesthetics, this representation serves well in contexts of finance presentations, analytical reports, and investment workshops. Ideal for projects examining technology-driven markets and forecasting trends, suitable for concepts on trading innovation.
Powered by 


2
downloads
downloads
Tags:
More
Credit Photo
If you would like to credit the Photo, here are some ways you can do so
Text Link
photo Link
<span class="text-link">
<span>
<a target="_blank" href=https://pikwizard.com/photo/countdown-and-data-analytics-in-energetic-stock-market-visual/e53755f598fce531e719083d4818750c/>PikWizard</a>
</span>
</span>
<span class="image-link">
<span
style="margin: 0 0 20px 0; display: inline-block; vertical-align: middle; width: 100%;"
>
<a
target="_blank"
href="https://pikwizard.com/photo/countdown-and-data-analytics-in-energetic-stock-market-visual/e53755f598fce531e719083d4818750c/"
style="text-decoration: none; font-size: 10px; margin: 0;"
>
<img src="https://pikwizard.com/pw/medium/e53755f598fce531e719083d4818750c.jpg" style="margin: 0; width: 100%;" alt="" />
<p style="font-size: 12px; margin: 0;">PikWizard</p>
</a>
</span>
</span>
Free (free of charge)
Free for personal and commercial use.
Author: Creative Art
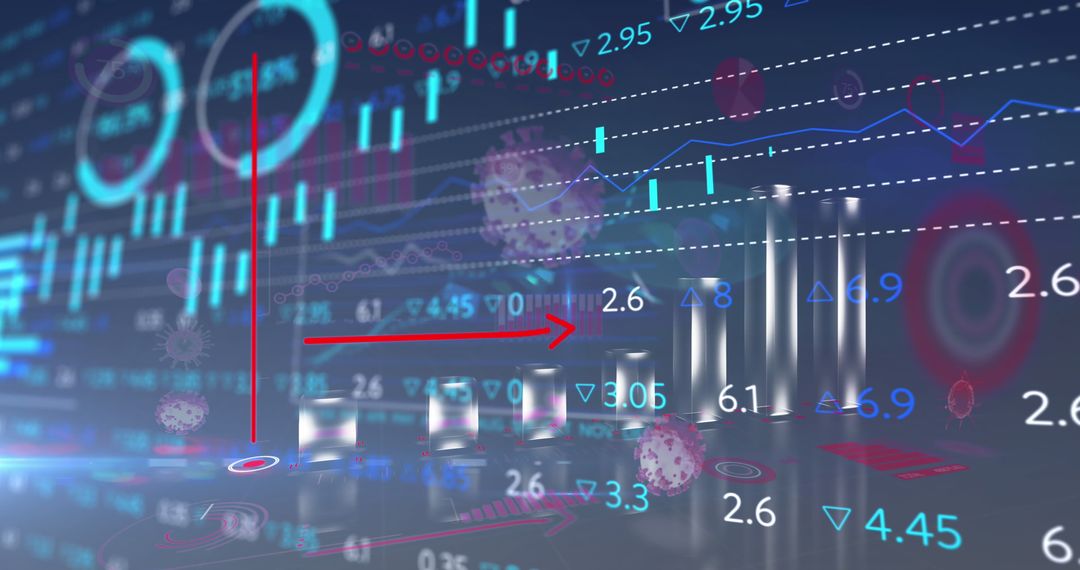
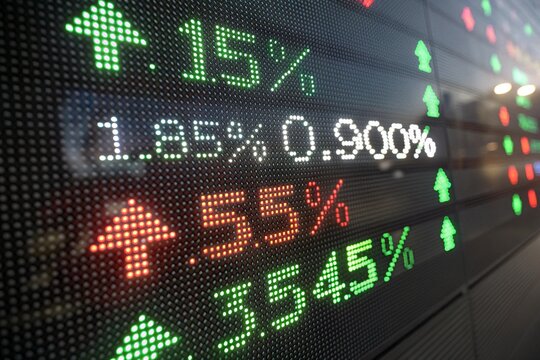
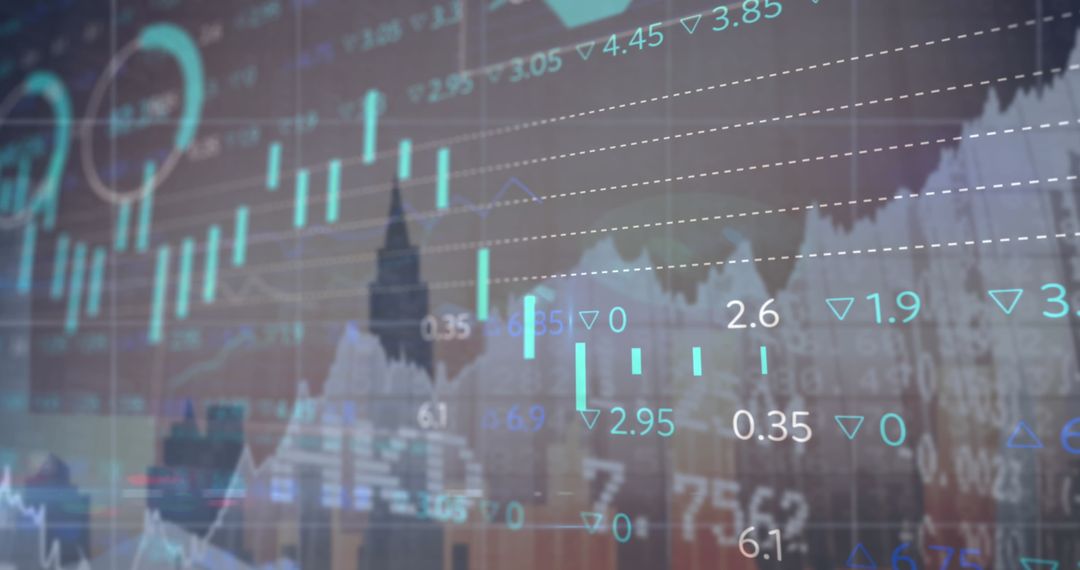
Similar Free Stock Images

Premium


Premium


Premium


Premium


Premium


Premium


Premium


Premium


Premium


Premium


Premium


Premium


Premium


Premium


Premium


Premium


Premium


Premium


Premium


Premium


Premium


Premium


Premium


Premium