
- Home >
- Stock Photos >
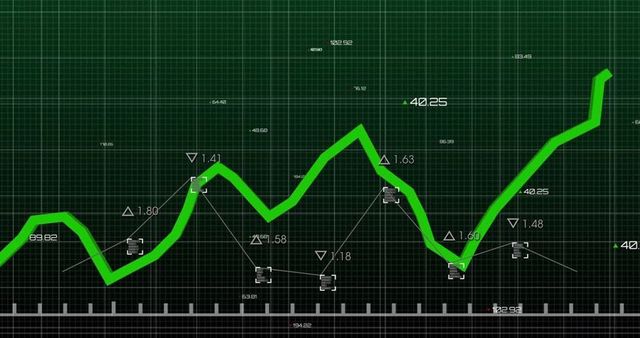
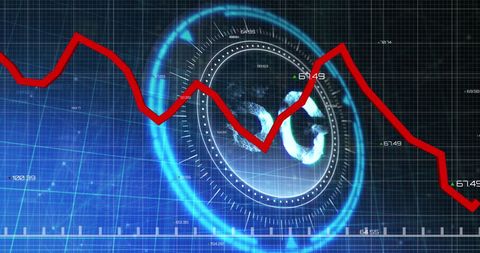
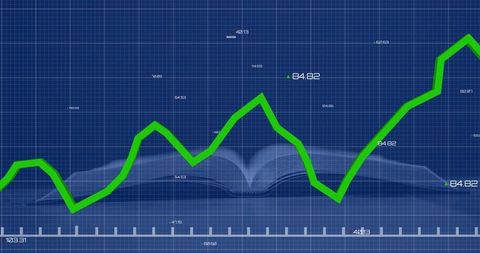
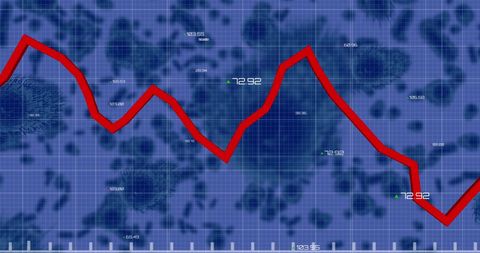
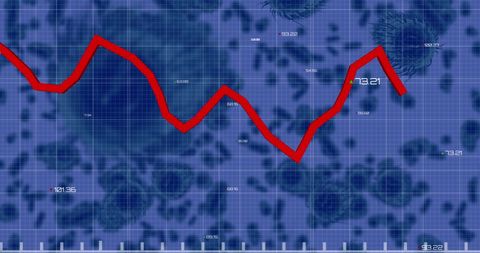
- COVID-19 Data Analysis with Digital Graph Visualization
COVID-19 Data Analysis with Digital Graph Visualization Image

Illustration shows a fluctuating data trend over enlarged COVID-19 cells on a grid background, symbolizing the intersection of health analytics and business insights during the pandemic. Ideal for use in articles discussing the economic impact of COVID-19, statistical modeling of virus trends, or digital technologies in healthcare.
Powered by  - Get 15% off with code: PIKWIZARD15


downloads
Tags:
More
Credit Photo
If you would like to credit the Photo, here are some ways you can do so
Text Link
photo Link
<span class="text-link">
<span>
<a target="_blank" href=https://pikwizard.com/photo/covid-19-data-analysis-with-digital-graph-visualization/e09c647bd4153515acb69b245662b696/>PikWizard</a>
</span>
</span>
<span class="image-link">
<span
style="margin: 0 0 20px 0; display: inline-block; vertical-align: middle; width: 100%;"
>
<a
target="_blank"
href="https://pikwizard.com/photo/covid-19-data-analysis-with-digital-graph-visualization/e09c647bd4153515acb69b245662b696/"
style="text-decoration: none; font-size: 10px; margin: 0;"
>
<img src="https://pikwizard.com/pw/medium/e09c647bd4153515acb69b245662b696.jpg" style="margin: 0; width: 100%;" alt="" />
<p style="font-size: 12px; margin: 0;">PikWizard</p>
</a>
</span>
</span>
Free (free of charge)
Free for personal and commercial use.
Author: Authentic Images
Similar Free Stock Images

Premium


Premium


Premium


Premium

Premium


Premium


Premium


Premium

Premium

Premium

Premium


Premium


Premium


Premium


Premium

Premium


Premium


Premium


Premium


Premium


Premium

Premium

Premium


Premium


Premium


Explore More Free Stock Images