- Home >
- Stock Photos >
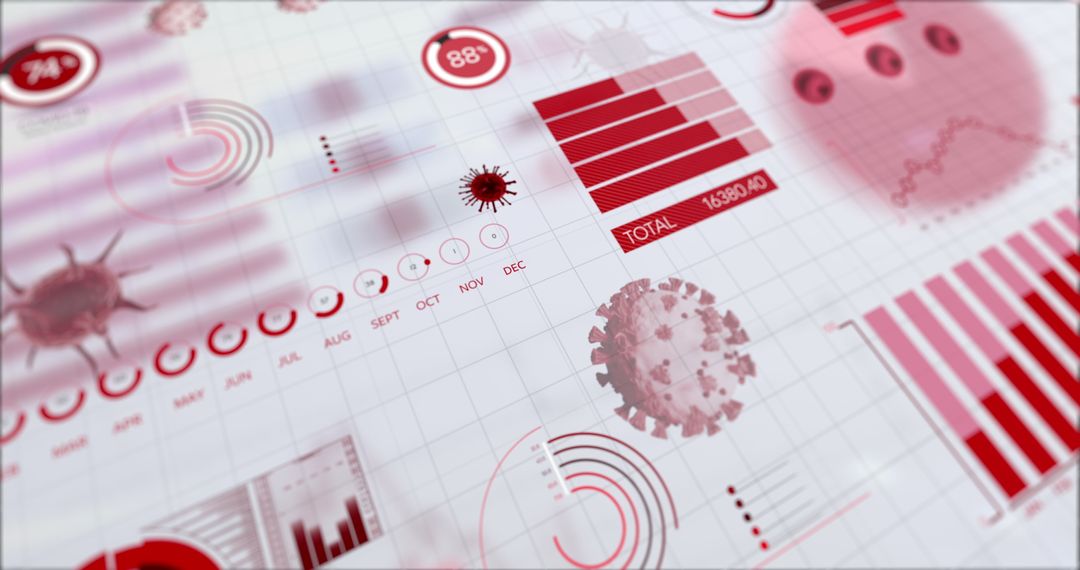
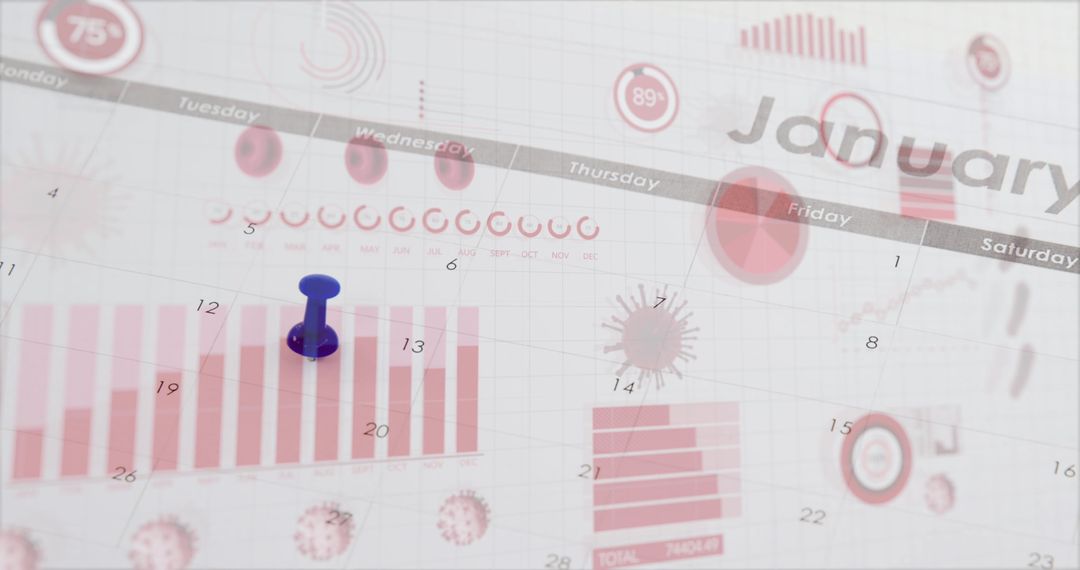
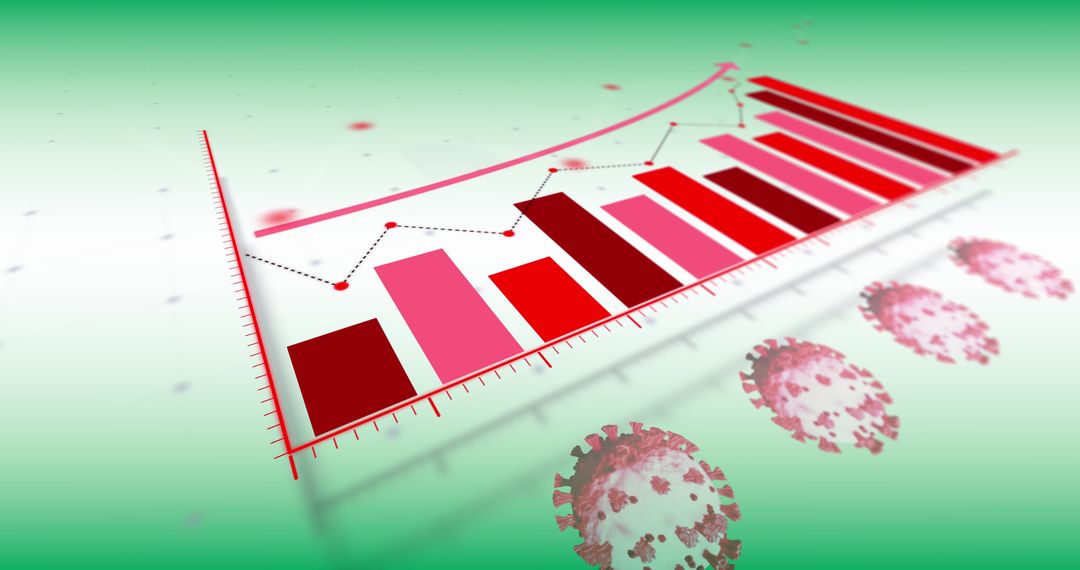
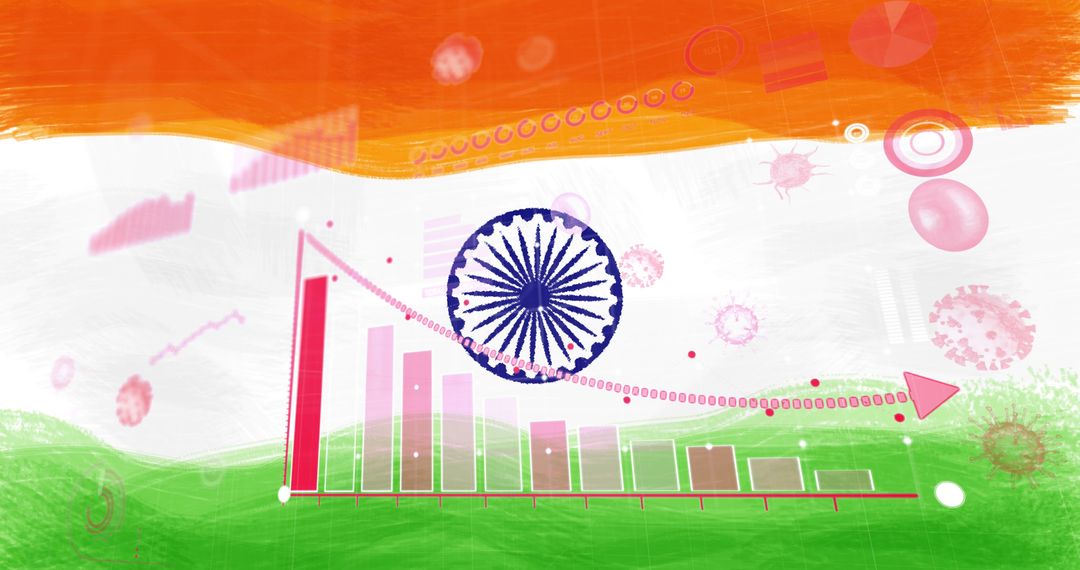
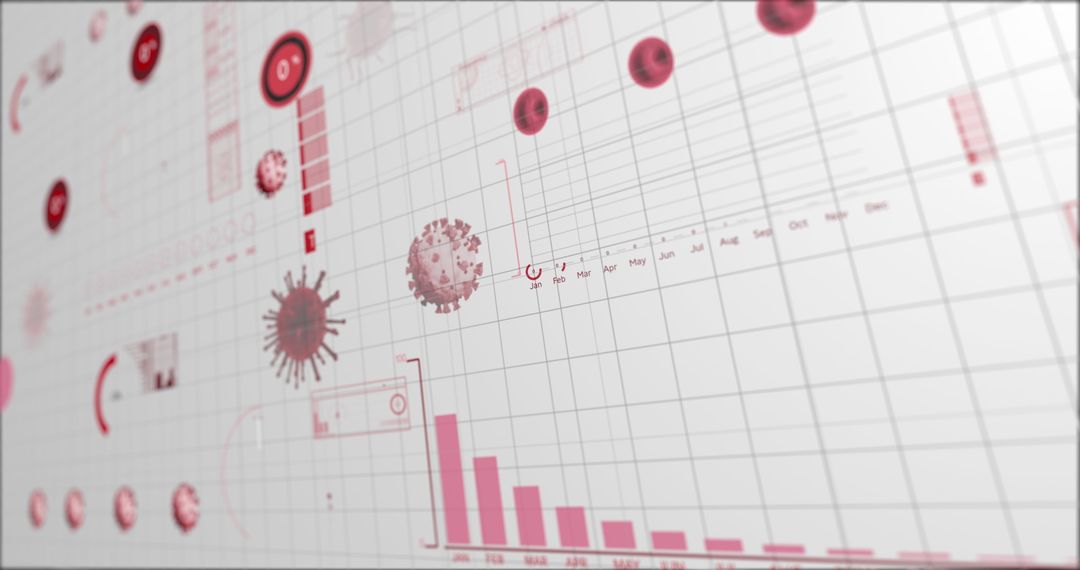
- Covid-19 Data Analysis with Graphs and Statistics Concept Art
Covid-19 Data Analysis with Graphs and Statistics Concept Art Image

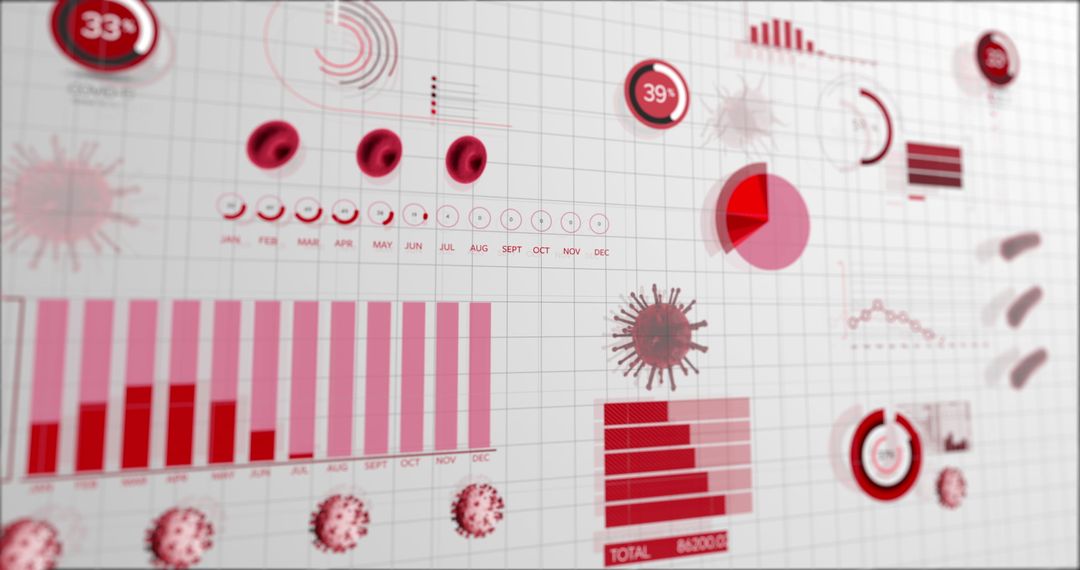
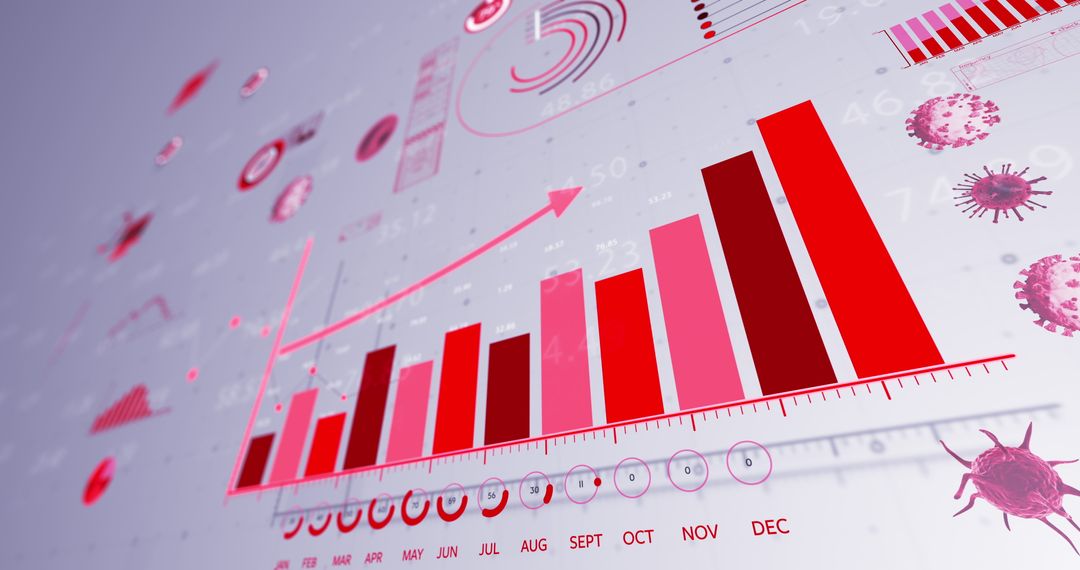
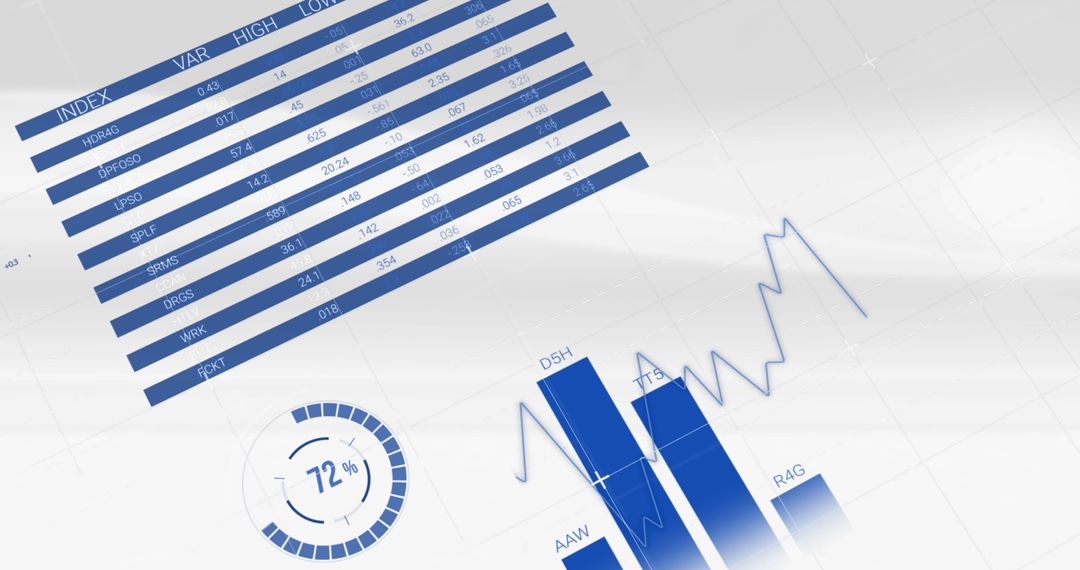
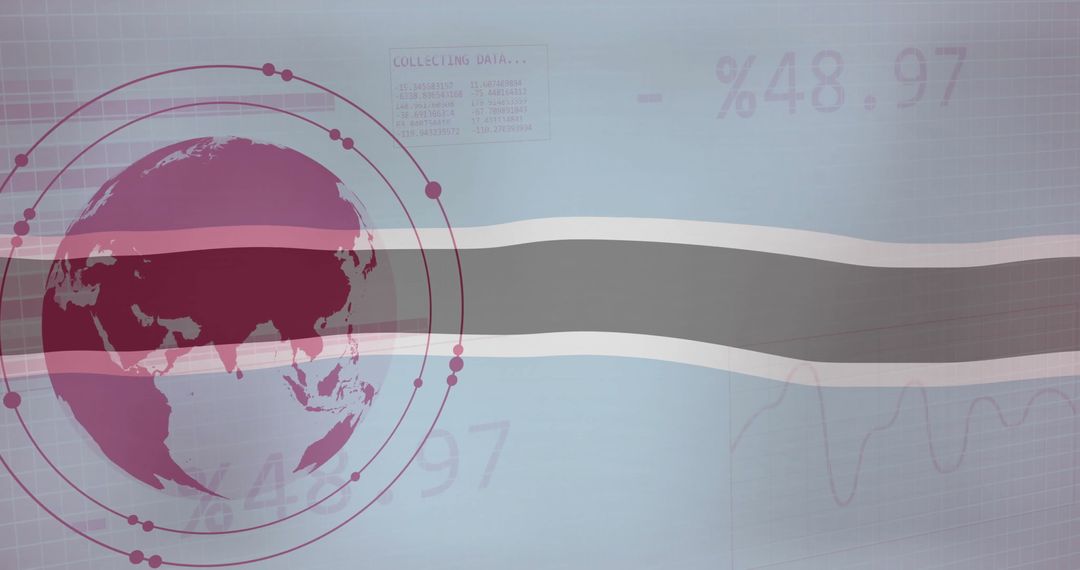
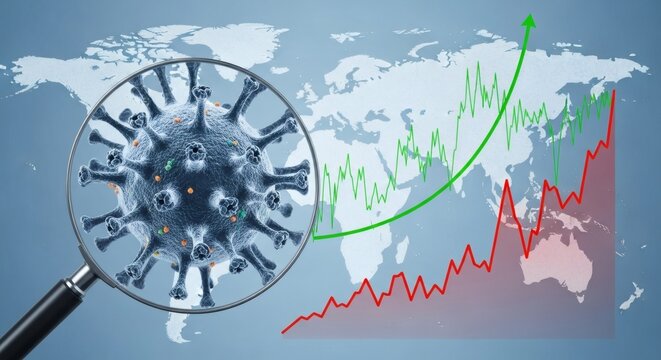
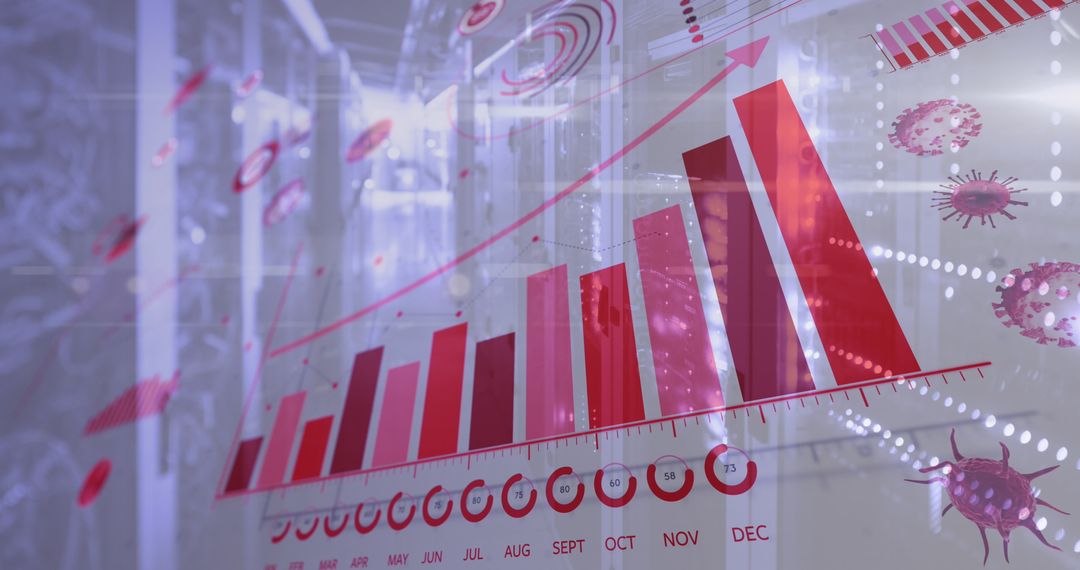
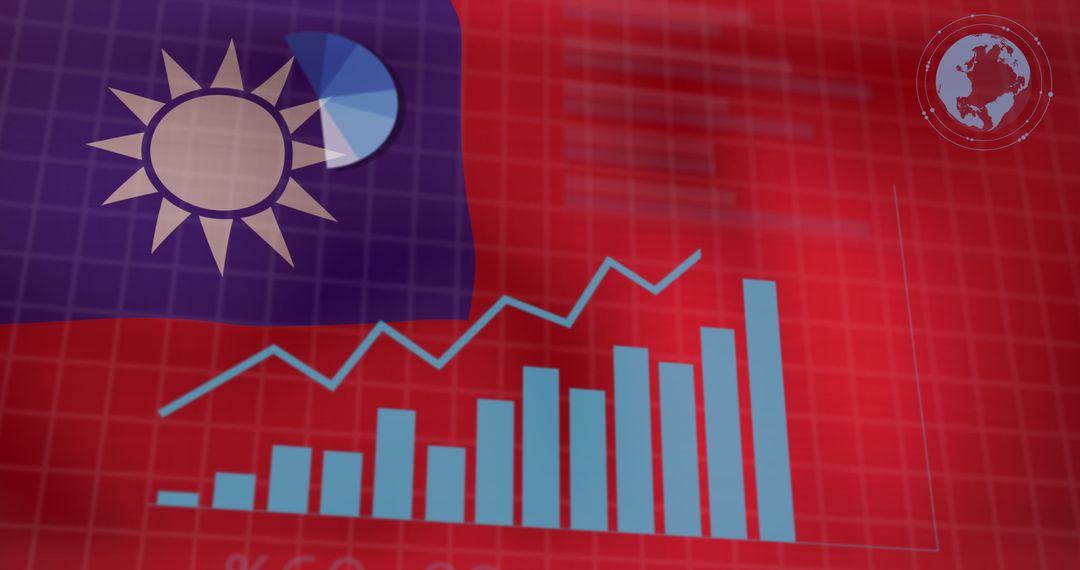
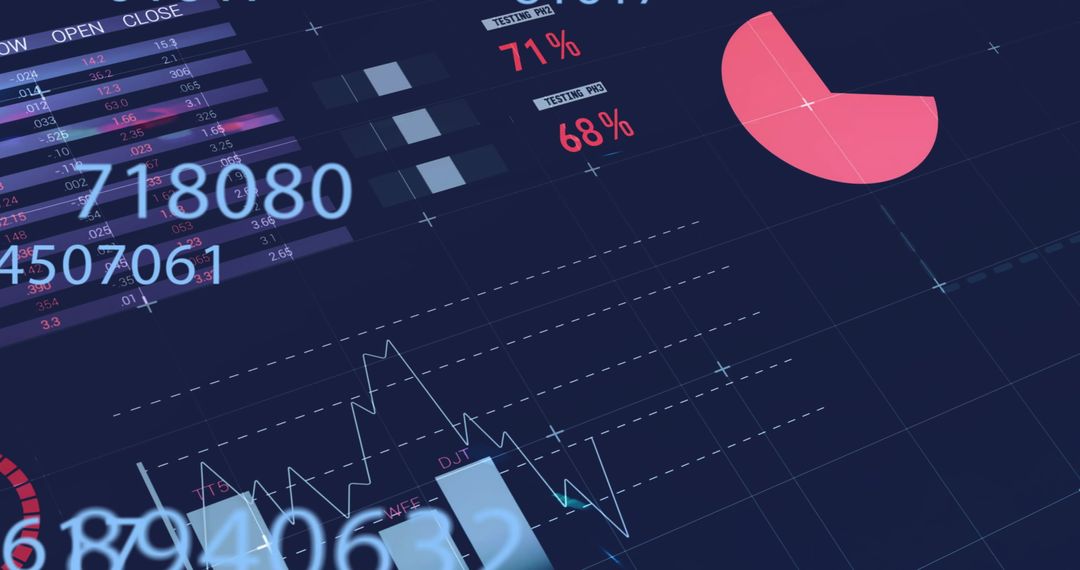
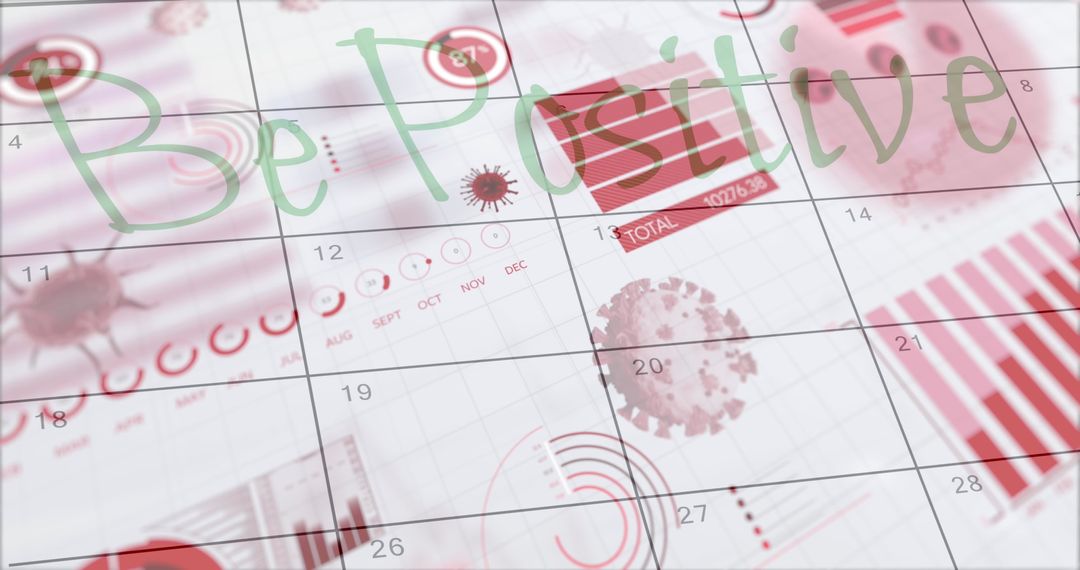
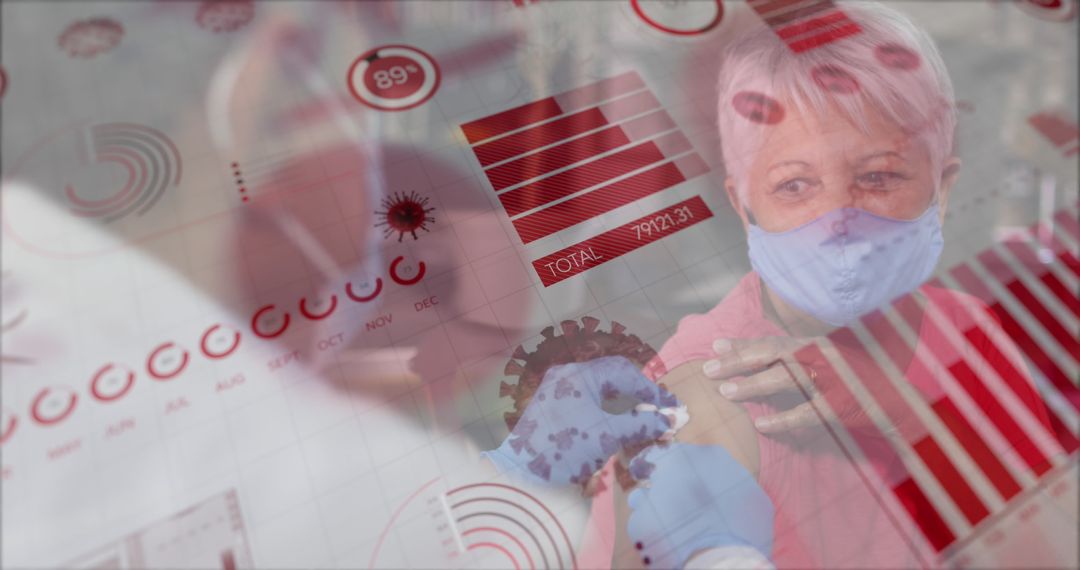
Art concept focuses on Covid-19 pandemic presentation with graphs and statistics, in digital format. Excellent for projects related to data analysis, pandemic reporting, or health visualization in digital platforms and educational content.
Powered by 


2
downloads
downloads
Tags:
More
Credit Photo
If you would like to credit the Photo, here are some ways you can do so
Text Link
photo Link
<span class="text-link">
<span>
<a target="_blank" href=https://pikwizard.com/photo/covid-19-data-analysis-with-graphs-and-statistics-concept-art/d310e0917778ed6c3044dedddc5a6f51/>PikWizard</a>
</span>
</span>
<span class="image-link">
<span
style="margin: 0 0 20px 0; display: inline-block; vertical-align: middle; width: 100%;"
>
<a
target="_blank"
href="https://pikwizard.com/photo/covid-19-data-analysis-with-graphs-and-statistics-concept-art/d310e0917778ed6c3044dedddc5a6f51/"
style="text-decoration: none; font-size: 10px; margin: 0;"
>
<img src="https://pikwizard.com/pw/medium/d310e0917778ed6c3044dedddc5a6f51.jpg" style="margin: 0; width: 100%;" alt="" />
<p style="font-size: 12px; margin: 0;">PikWizard</p>
</a>
</span>
</span>
Free (free of charge)
Free for personal and commercial use.
Author: Awesome Content
Similar Free Stock Images
Premium


Premium


Premium


Premium


Premium


Premium


Premium


Premium


Premium


Premium


Premium


Premium


Premium


Premium


Premium


Premium


Premium


Premium


Premium


Premium


Premium


Premium


Premium


Premium