- Home >
- Stock Photos >
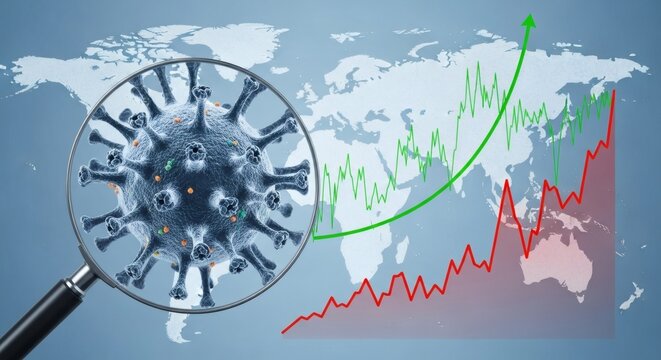
- COVID-19 Data Analysis with Graphs and Viral Corona Cells
COVID-19 Data Analysis with Graphs and Viral Corona Cells Image

Visually represents the data analysis associated with the COVID-19 pandemic. Featuring graphs and statistics surrounded by virus cells, it portrays the impact of the virus on data processing. Useful for illustrating topics related to the pandemic, health data analytics, and statistical research in reports, articles, and presentations.
Powered by 


2
downloads
downloads
Tags:
More
Credit Photo
If you would like to credit the Photo, here are some ways you can do so
Text Link
photo Link
<span class="text-link">
<span>
<a target="_blank" href=https://pikwizard.com/photo/covid-19-data-analysis-with-graphs-and-viral-corona-cells/fe93b695b1b9e0368466b48b06c765c1/>PikWizard</a>
</span>
</span>
<span class="image-link">
<span
style="margin: 0 0 20px 0; display: inline-block; vertical-align: middle; width: 100%;"
>
<a
target="_blank"
href="https://pikwizard.com/photo/covid-19-data-analysis-with-graphs-and-viral-corona-cells/fe93b695b1b9e0368466b48b06c765c1/"
style="text-decoration: none; font-size: 10px; margin: 0;"
>
<img src="https://pikwizard.com/pw/medium/fe93b695b1b9e0368466b48b06c765c1.jpg" style="margin: 0; width: 100%;" alt="" />
<p style="font-size: 12px; margin: 0;">PikWizard</p>
</a>
</span>
</span>
Free (free of charge)
Free for personal and commercial use.
Author: People Creations
Similar Free Stock Images

Premium


Premium


Premium


Premium


Premium


Premium


Premium


Premium


Premium


Premium


Premium


Premium


Premium


Premium


Premium


Premium


Premium


Premium


Premium


Premium


Premium


Premium


Premium


Premium