- Home >
- Stock Photos >
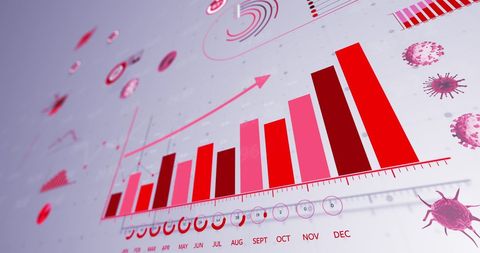
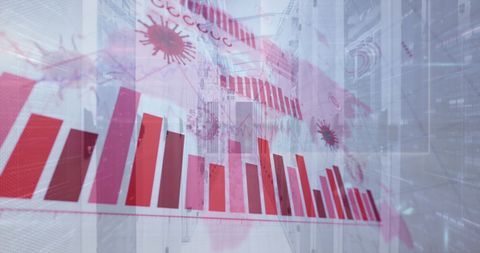
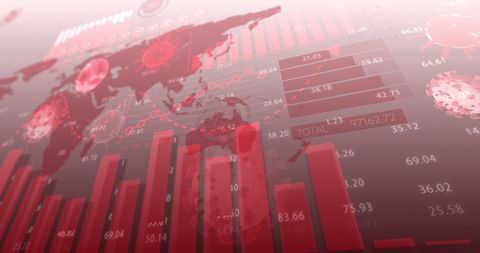
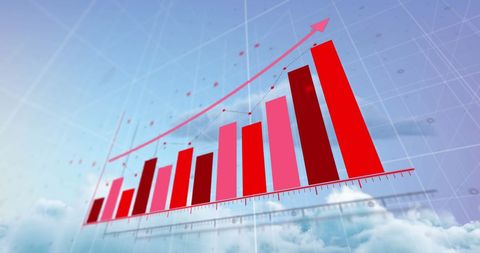
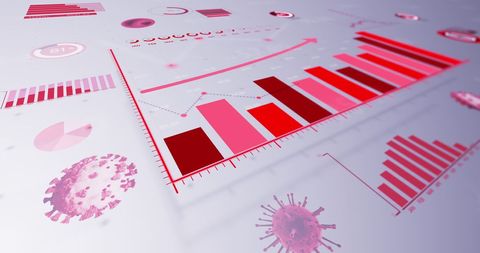
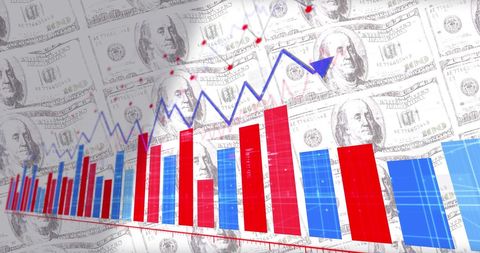
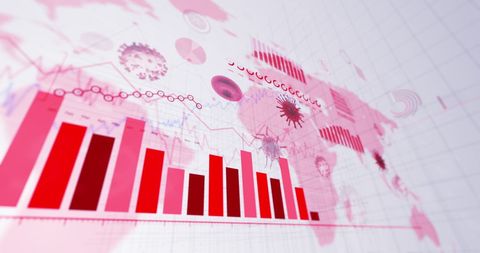
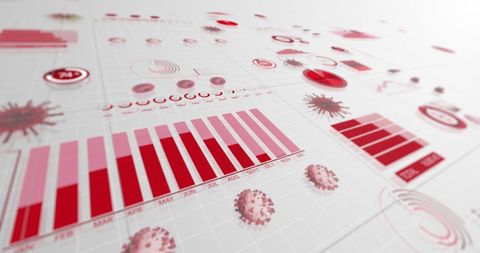
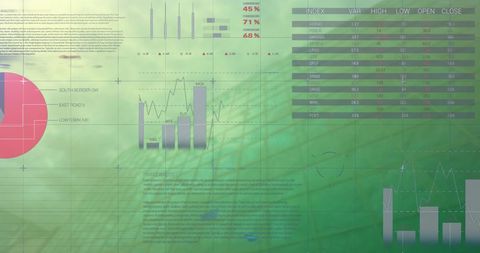
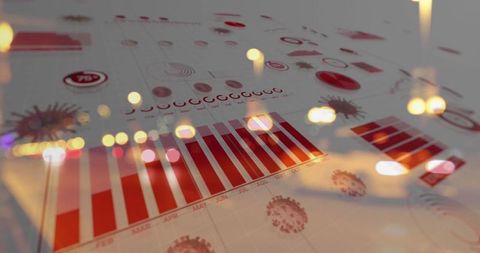
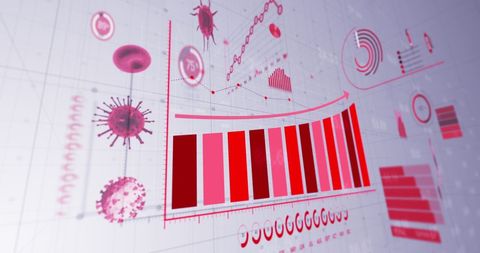
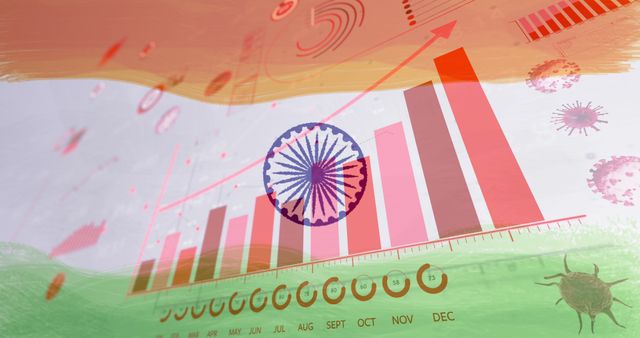
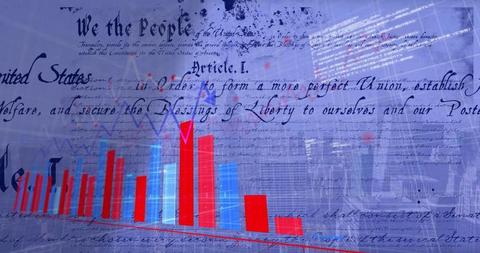
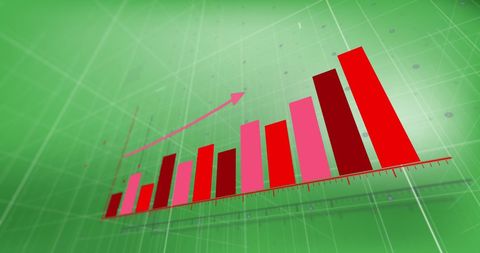
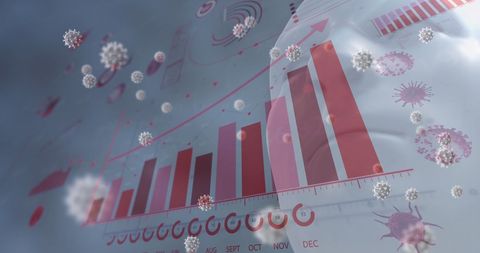
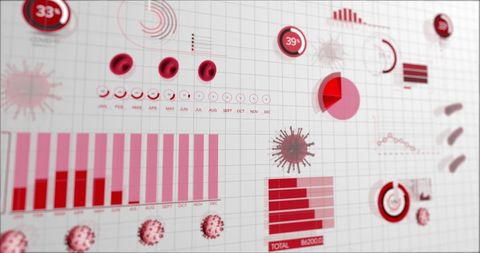
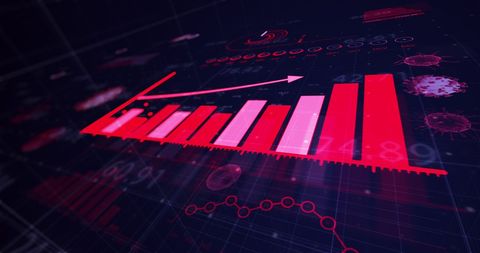
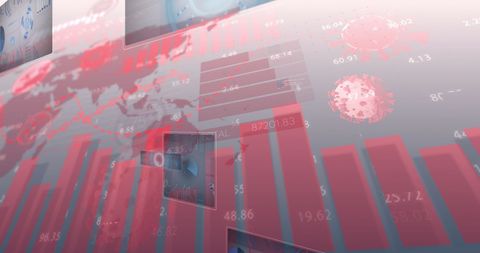
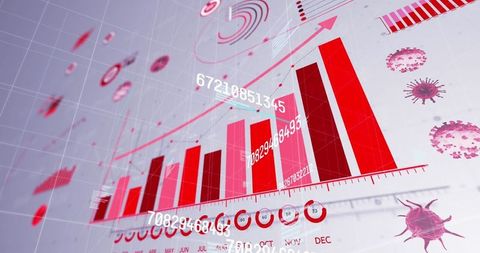
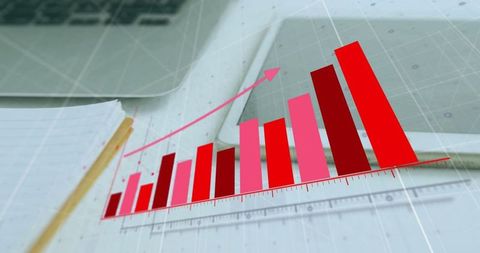
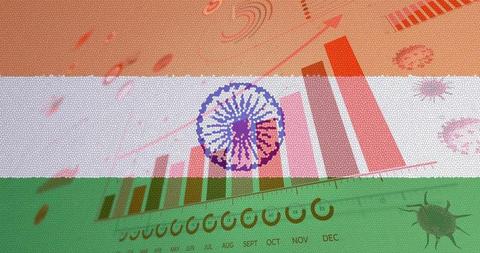
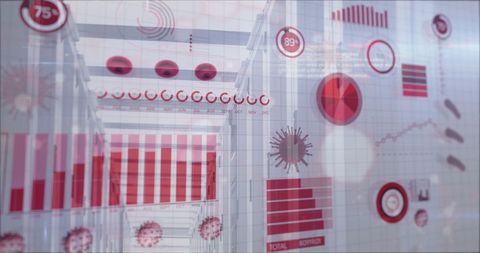
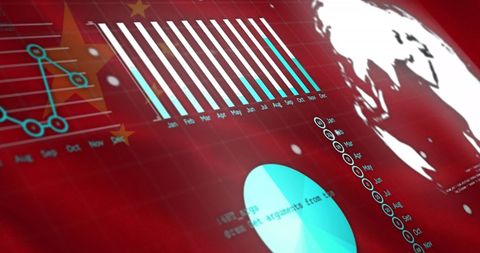
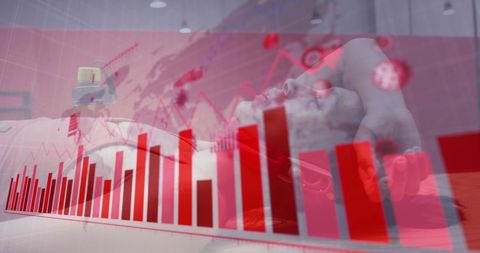
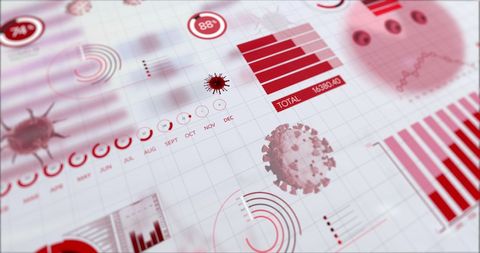
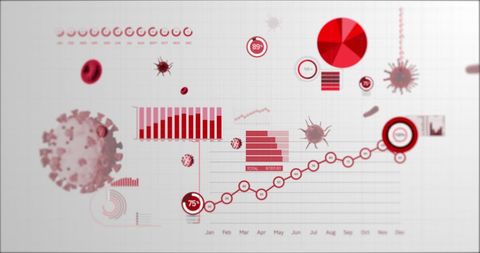
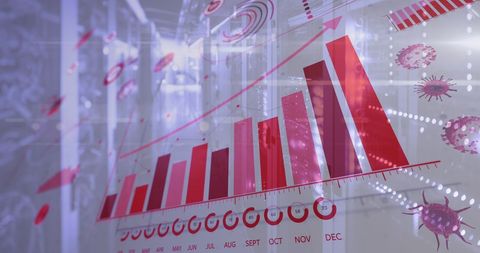
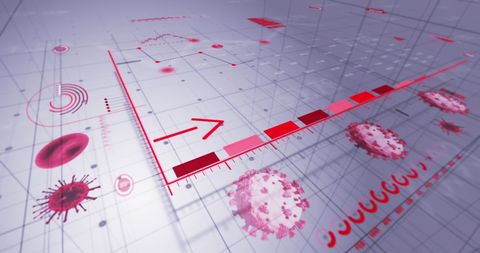
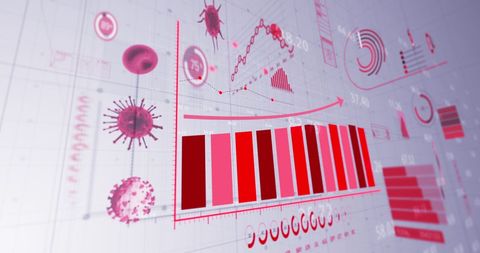
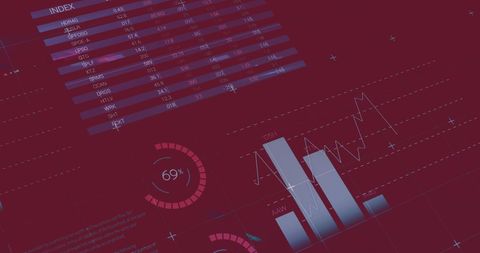
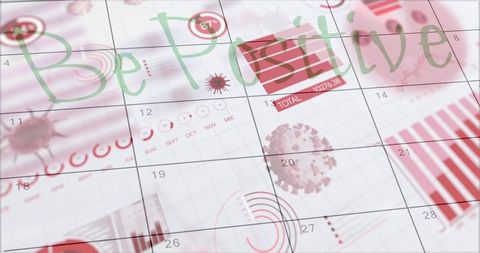
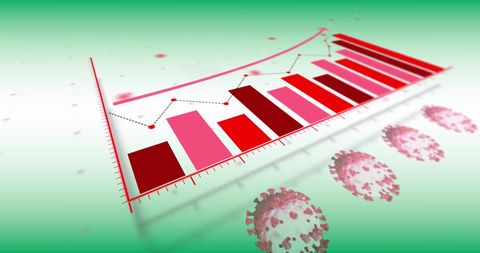
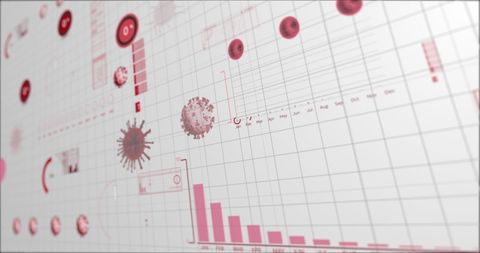
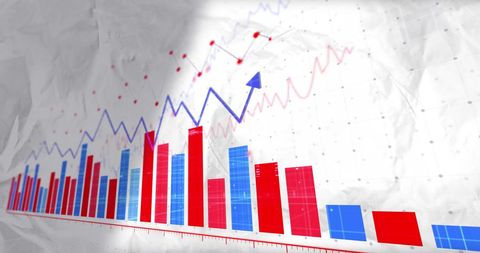
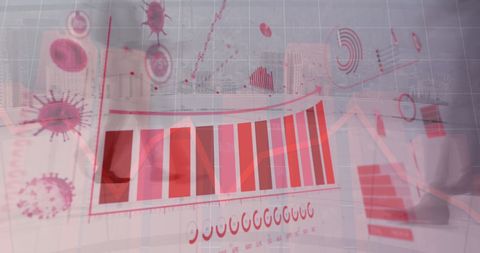
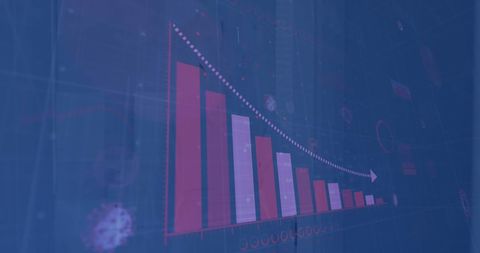
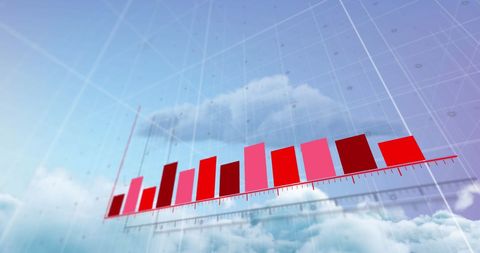
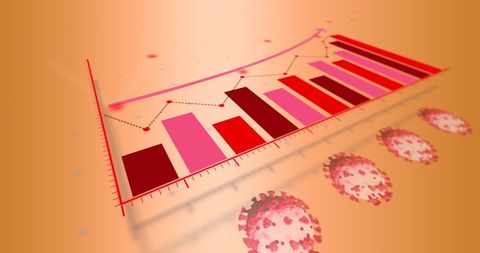
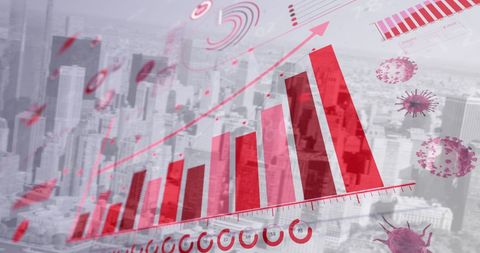
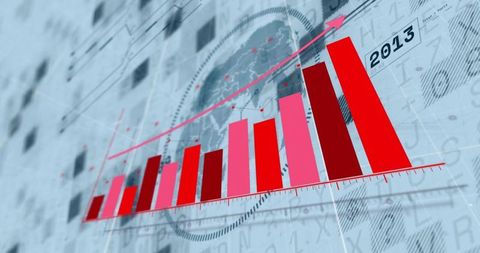
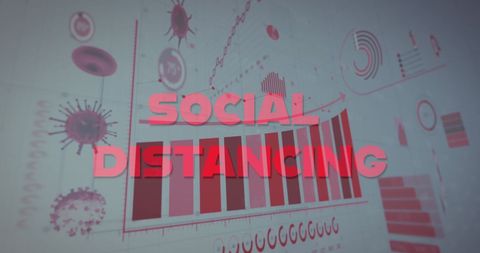
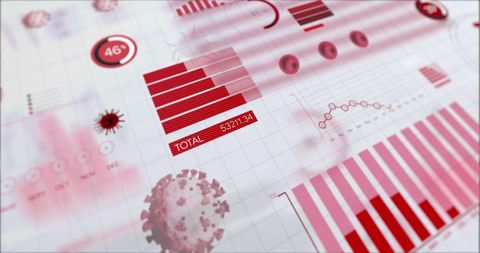
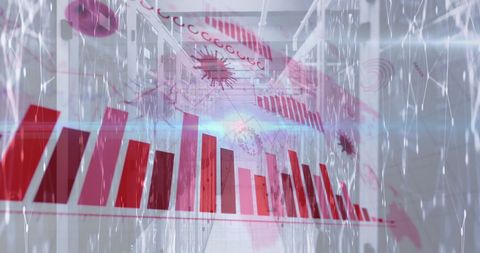
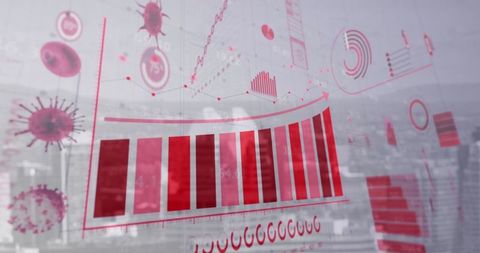
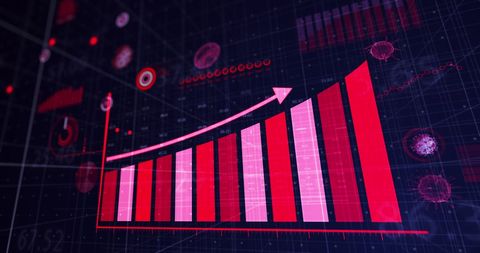
- COVID-19 Data and Statistics Visualization with Red Bars
COVID-19 Data and Statistics Visualization with Red Bars Image
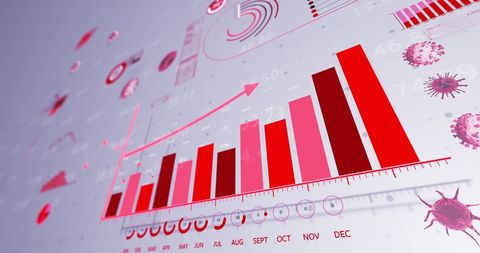
This visually engaging digital representation emphasizes COVID-19 data trends with red bars, highlighting shifts in analytics. Ideal for educational materials, presentations on global health trends, or articles discussing pandemic statistics and analysis methods.

downloads
Tags:
More
Credit Photo
If you would like to credit the Photo, here are some ways you can do so
Text Link
photo Link
<span class="text-link">
<span>
<a target="_blank" href=https://pikwizard.com/photo/covid-19-data-and-statistics-visualization-with-red-bars/577b276753b8d9202b4229d4729c36ab/>PikWizard</a>
</span>
</span>
<span class="image-link">
<span
style="margin: 0 0 20px 0; display: inline-block; vertical-align: middle; width: 100%;"
>
<a
target="_blank"
href="https://pikwizard.com/photo/covid-19-data-and-statistics-visualization-with-red-bars/577b276753b8d9202b4229d4729c36ab/"
style="text-decoration: none; font-size: 10px; margin: 0;"
>
<img src="https://pikwizard.com/pw/medium/577b276753b8d9202b4229d4729c36ab.jpg" style="margin: 0; width: 100%;" alt="" />
<p style="font-size: 12px; margin: 0;">PikWizard</p>
</a>
</span>
</span>
Free (free of charge)
Free for personal and commercial use.
Author: People Creations