- Home >
- Stock Photos >
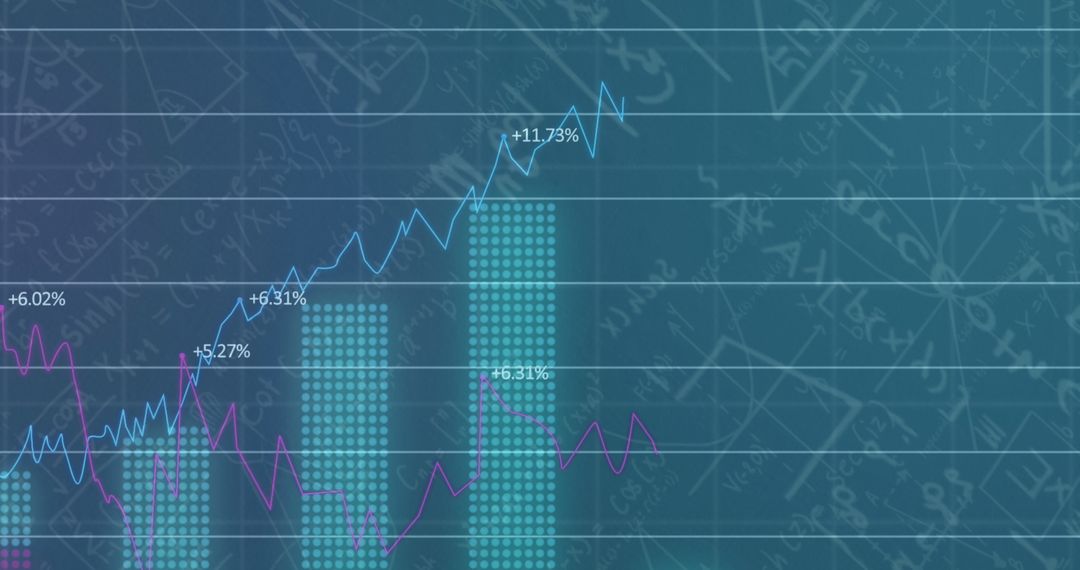
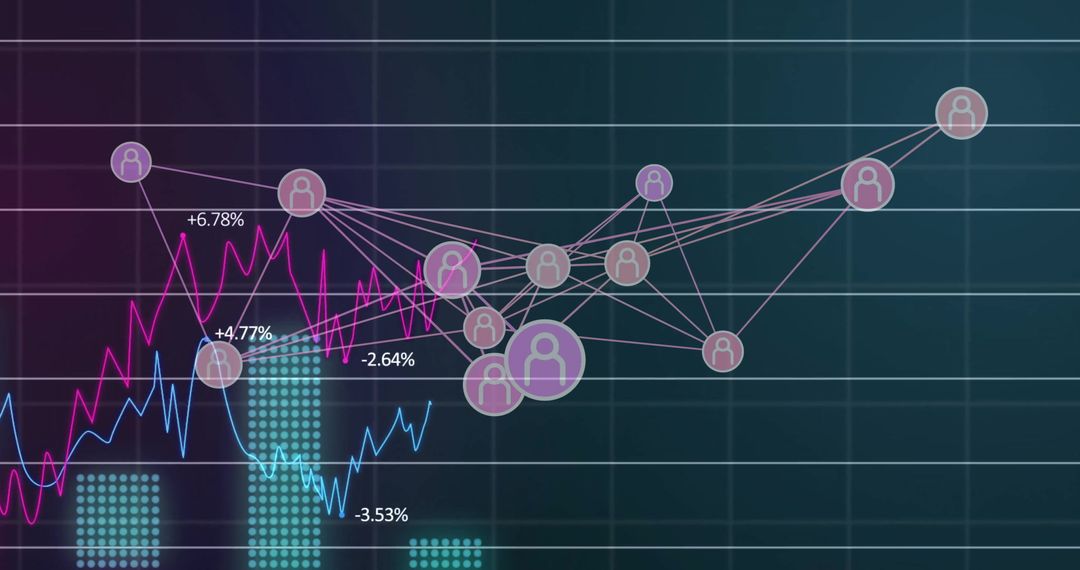
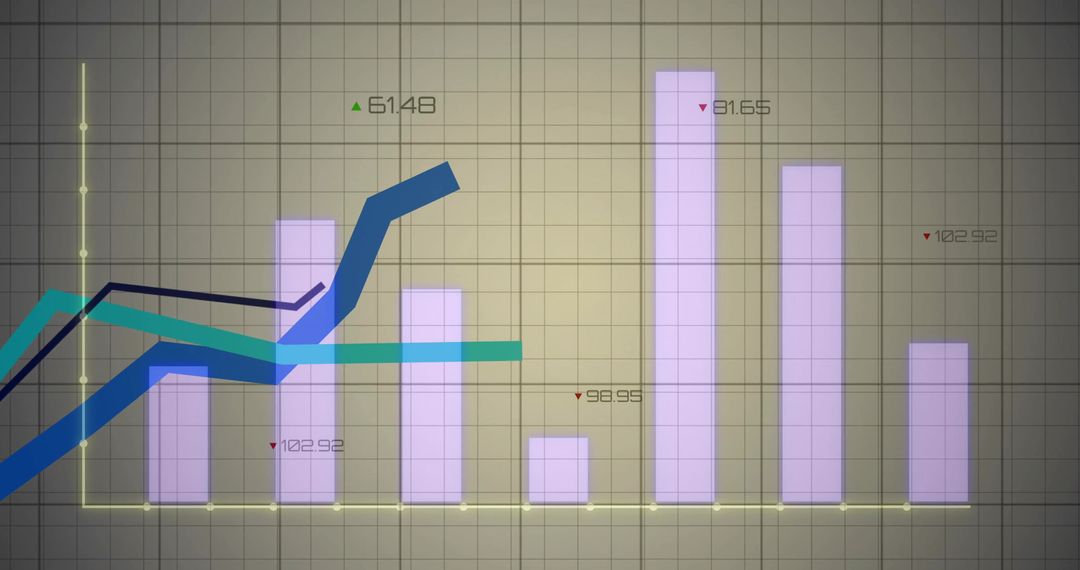
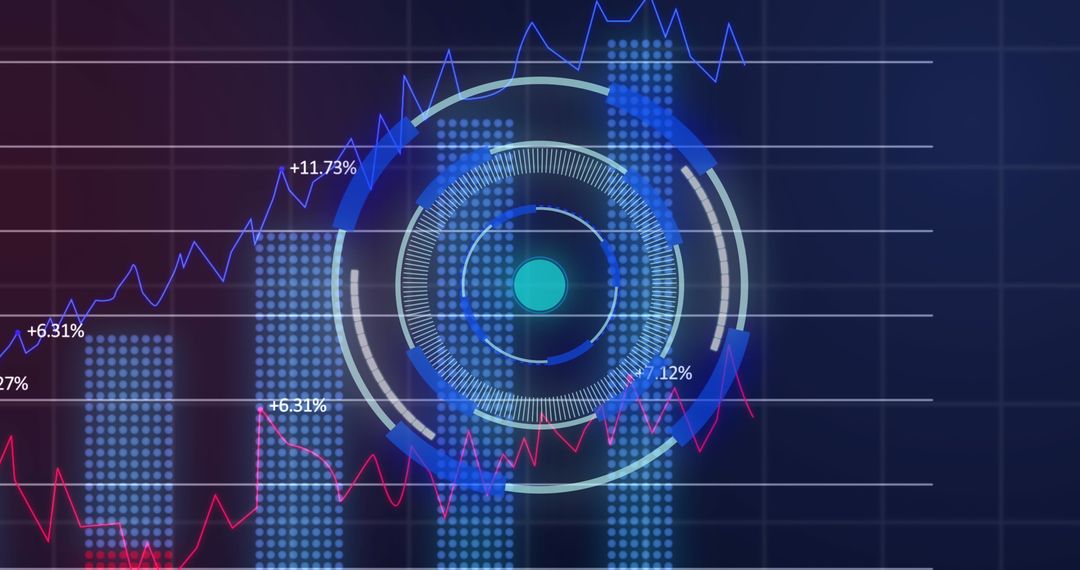
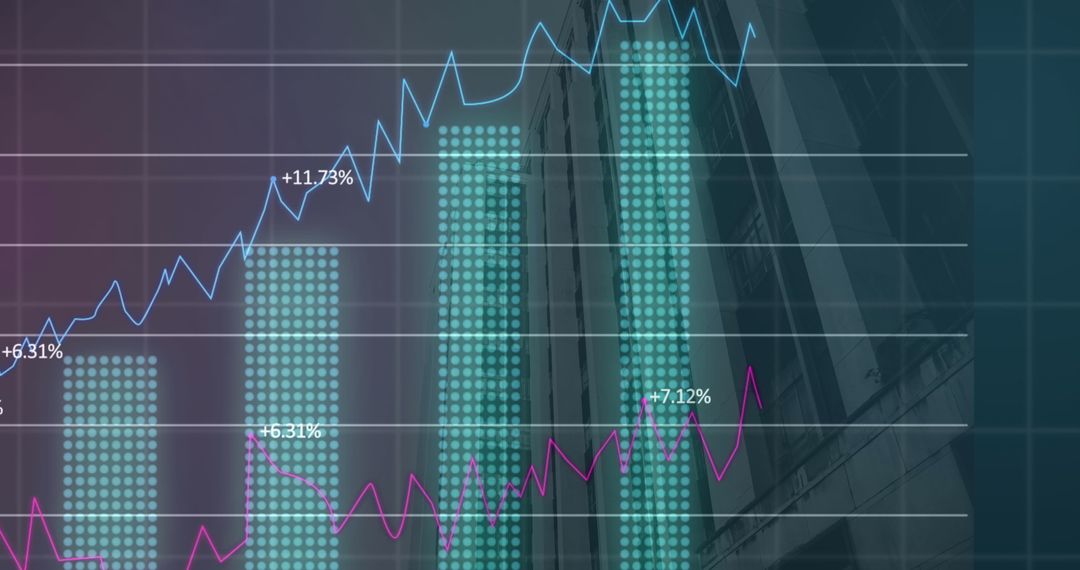
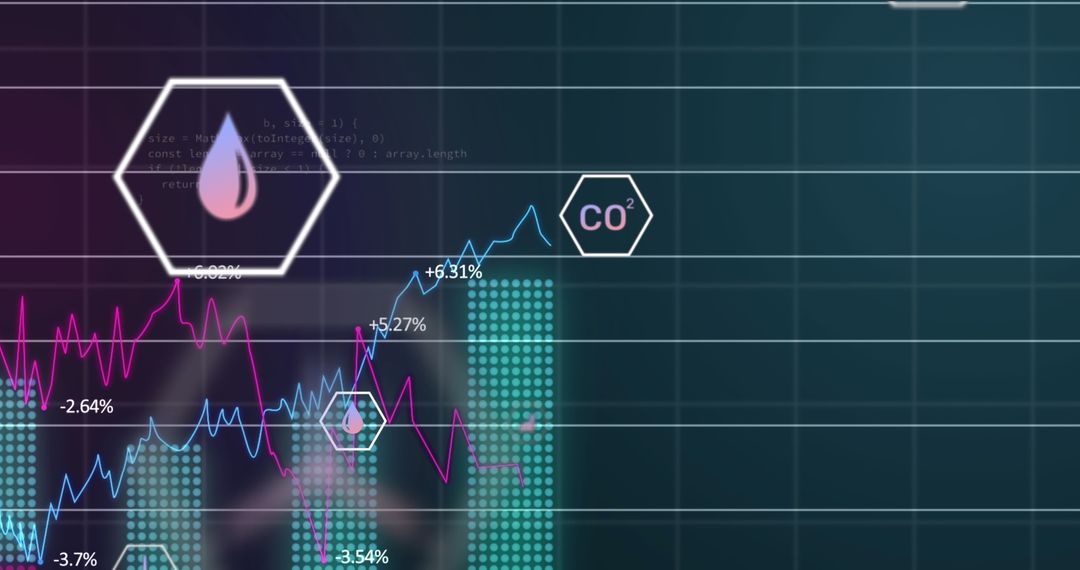
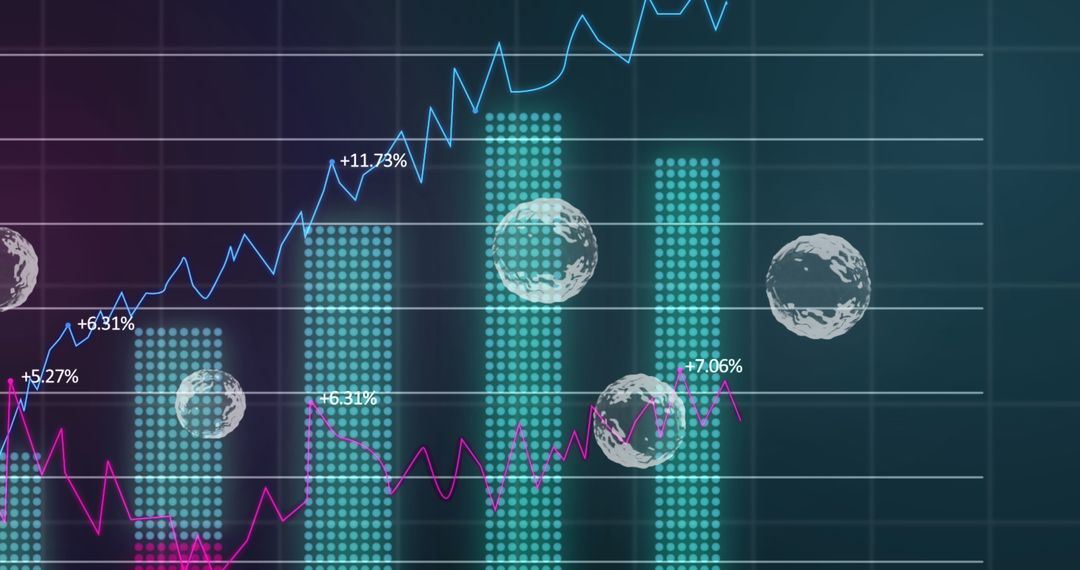
- Cyan and Magenta Analytics Dashboard Showing Bar Charts, Trend Lines and Circular Icons
Cyan and Magenta Analytics Dashboard Showing Bar Charts, Trend Lines and Circular Icons Image

Dark gradient dashboard showing cyan dot-matrix vertical bars, blue and magenta trend lines, horizontal gridlines, numeric labels and circular icons representing growth, energy, drop and recycling. Light code snippets and subtle data points adding tech aesthetic. High-contrast color palette creating modern finance and technology look. Using flat minimal futuristic vector style with glowing neon accents for modern visual appeal. Serving for fintech presentations, investor reports, website hero banners, blog visuals, slide decks, social media marketing and UI concept presentations. Providing versatile asset for illustrating data analysis, market performance, sustainability metrics, investment trends and business intelligence storytelling.
Powered by 


0
downloads
downloads
Tags:
More
Credit Photo
If you would like to credit the Photo, here are some ways you can do so
Text Link
photo Link
<span class="text-link">
<span>
<a target="_blank" href=https://pikwizard.com/photo/cyan-and-magenta-analytics-dashboard-showing-bar-charts-trend-lines-and-circular-icons/d7c427e38595e0d80650a1bd28d0e304/>PikWizard</a>
</span>
</span>
<span class="image-link">
<span
style="margin: 0 0 20px 0; display: inline-block; vertical-align: middle; width: 100%;"
>
<a
target="_blank"
href="https://pikwizard.com/photo/cyan-and-magenta-analytics-dashboard-showing-bar-charts-trend-lines-and-circular-icons/d7c427e38595e0d80650a1bd28d0e304/"
style="text-decoration: none; font-size: 10px; margin: 0;"
>
<img src="https://pikwizard.com/pw/medium/d7c427e38595e0d80650a1bd28d0e304.jpg" style="margin: 0; width: 100%;" alt="" />
<p style="font-size: 12px; margin: 0;">PikWizard</p>
</a>
</span>
</span>
Free (free of charge)
Free for personal and commercial use.
Author: Creative Art
Similar Free Stock Images

Premium


Premium


Premium


Premium


Premium


Premium


Premium


Premium


Premium


Premium


Premium


Premium


Premium


Premium


Premium


Premium


Premium


Premium


Premium


Premium


Premium


Premium


Premium


Premium