- Home >
- Stock Photos >
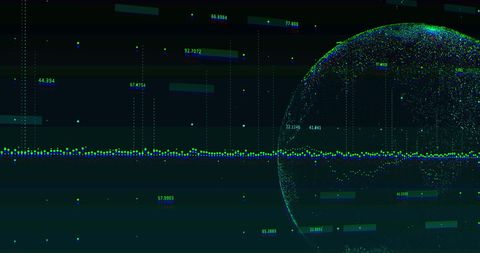
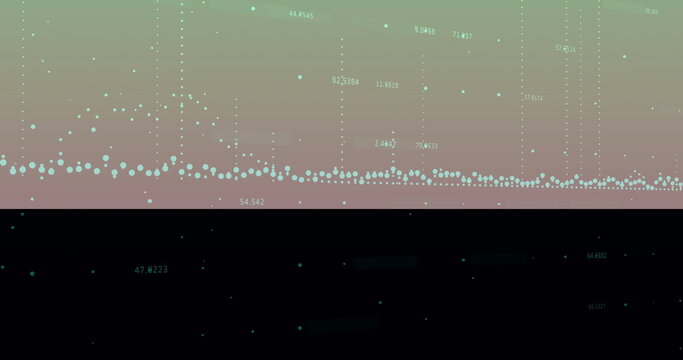
- Cyan Data Points Band Displaying Dense Time-Series Scatterplot on Dark Analytics Dashboard
Cyan Data Points Band Displaying Dense Time-Series Scatterplot on Dark Analytics Dashboard Image
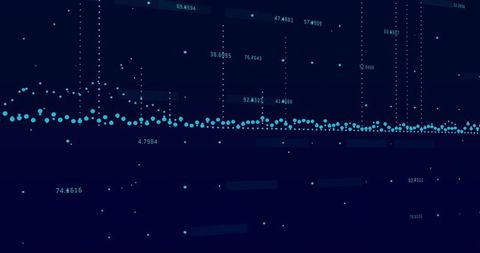
Displaying dense cyan data point band stretching horizontally across dark navy background with numeric labels and dotted vertical guides. Providing high-tech, minimal aesthetic suitable for technology, finance, and science themes. Working well as background for dashboard mockups, presentation slides, website hero banners, fintech product pages, data science reports, annual reports, and marketing collateral. Leaving ample negative space for overlaying text, logos, or UI elements. Scaling to high-resolution layouts and supporting motion graphics for animated intro or explainer content.
Powered by 


downloads
Tags:
More
Credit Photo
If you would like to credit the Photo, here are some ways you can do so
Text Link
photo Link
<span class="text-link">
<span>
<a target="_blank" href=https://pikwizard.com/photo/cyan-data-points-band-displaying-dense-time-series-scatterplot-on-dark-analytics-dashboard/1fd4d3da0a4163716458740c4358c352/>PikWizard</a>
</span>
</span>
<span class="image-link">
<span
style="margin: 0 0 20px 0; display: inline-block; vertical-align: middle; width: 100%;"
>
<a
target="_blank"
href="https://pikwizard.com/photo/cyan-data-points-band-displaying-dense-time-series-scatterplot-on-dark-analytics-dashboard/1fd4d3da0a4163716458740c4358c352/"
style="text-decoration: none; font-size: 10px; margin: 0;"
>
<img src="https://pikwizard.com/pw/medium/1fd4d3da0a4163716458740c4358c352.jpg" style="margin: 0; width: 100%;" alt="" />
<p style="font-size: 12px; margin: 0;">PikWizard</p>
</a>
</span>
</span>
Free (free of charge)
Free for personal and commercial use.
Author: Authentic Images