
- Home >
- Stock Photos >
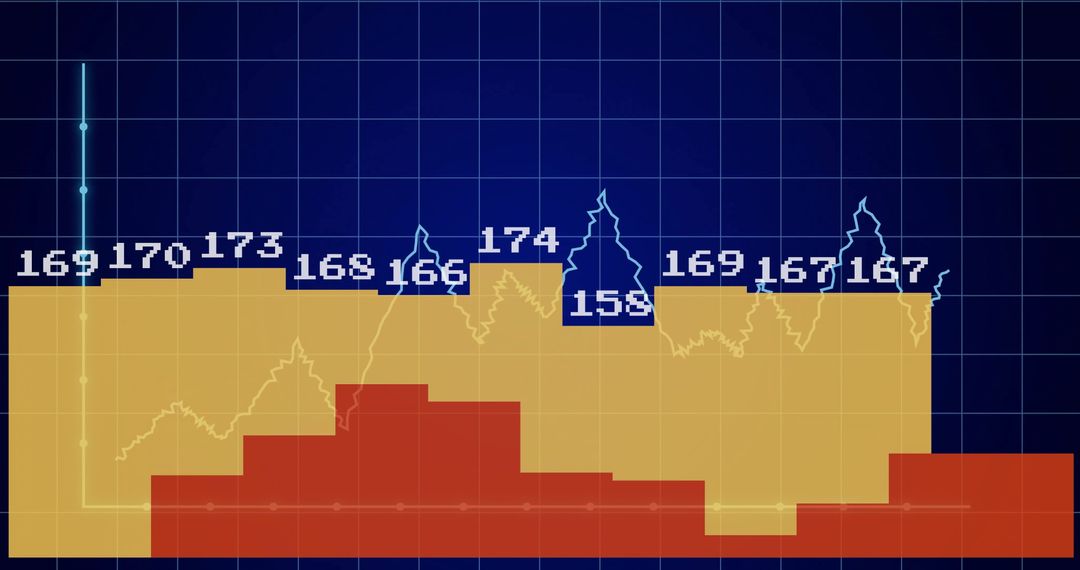
- Cyan Line Chart Showing Fluctuating Data with Binary Overlay and 62.50 Label
Cyan Line Chart Showing Fluctuating Data with Binary Overlay and 62.50 Label Image

Showing cyan line chart with zigzagging trend line, binary code overlay, and 62.50 numeric label, conveying data movement and volatility. Serving finance reports, analytics dashboards, fintech landing pages, and technology presentations by adding modern digital aesthetic. Providing strong focal point for hero banners, slide decks, blog headers, social media posts, and marketing materials. Allowing overlaying of custom text, logos, and icons while maintaining high-contrast legibility and scalable composition for web or print. Helping explain market trends, illustrate performance metrics, and enhance content about data science, machine learning, or business intelligence.
Powered by  - Get 15% off with code: PIKWIZARD15


0
downloads
downloads
Tags:
More
Credit Photo
If you would like to credit the Photo, here are some ways you can do so
Text Link
photo Link
<span class="text-link">
<span>
<a target="_blank" href=https://pikwizard.com/photo/cyan-line-chart-showing-fluctuating-data-with-binary-overlay-and-62-50-label/d7823734448cd95eb4082a0281bebbc0/>PikWizard</a>
</span>
</span>
<span class="image-link">
<span
style="margin: 0 0 20px 0; display: inline-block; vertical-align: middle; width: 100%;"
>
<a
target="_blank"
href="https://pikwizard.com/photo/cyan-line-chart-showing-fluctuating-data-with-binary-overlay-and-62-50-label/d7823734448cd95eb4082a0281bebbc0/"
style="text-decoration: none; font-size: 10px; margin: 0;"
>
<img src="https://pikwizard.com/pw/medium/d7823734448cd95eb4082a0281bebbc0.jpg" style="margin: 0; width: 100%;" alt="" />
<p style="font-size: 12px; margin: 0;">PikWizard</p>
</a>
</span>
</span>
Free (free of charge)
Free for personal and commercial use.
Author: Awesome Content
Similar Free Stock Images

Premium


Premium


Premium


Premium


Premium


Premium


Premium


Premium


Premium


Premium


Premium


Premium


Premium


Premium


Premium


Premium


Premium


Premium


Premium


Premium


Premium


Premium


Premium


Premium

